
Mapping Zn and Pb Mineralization in Ballinalack, Ireland
Project aims
The project aims to raise Adrok’s technology level for identify mineral zones in onshore Ireland. The project partly involves re-processing data from a previous visit in 2010 with a brand new survey, the data of which was collected in April 2018.
Exploration/Project challenges
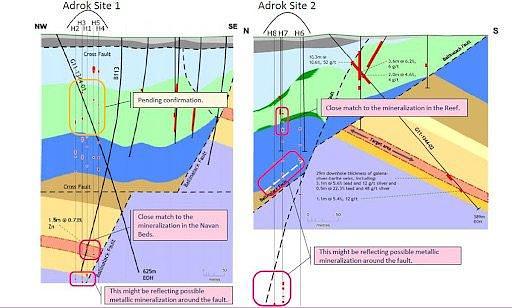
The main challenge was identifying the basement, the mineral zones within the limestones and identifying evidence for faulting.
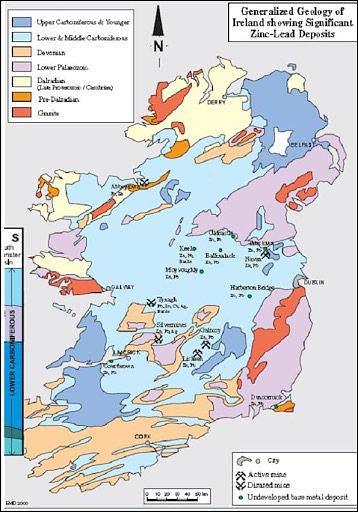
Geological context
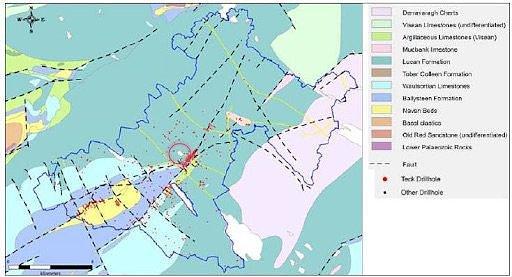
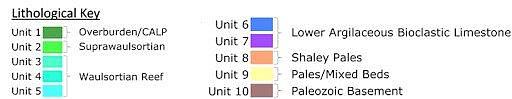
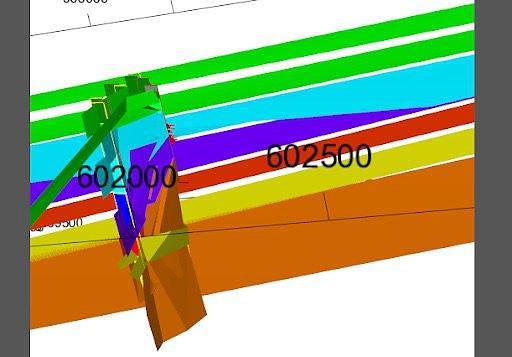
The survey area is located in the Central Ireland Basin. There are a series of north-east trending fault structures which sometimes displaces some of the sedimentary units.
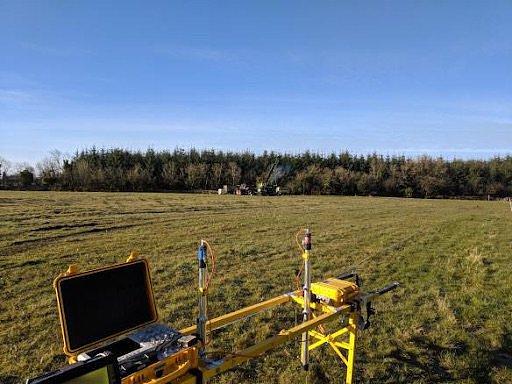
Adrok’s results
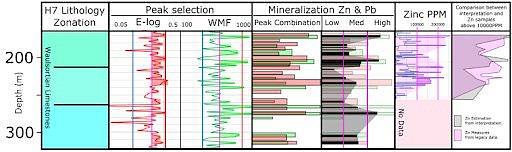
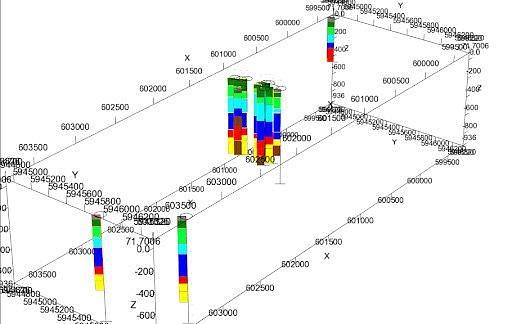
Adrok collected eight sites during the 2018 survey. Data processing extracted the energy and frequency data from the raw files. By noting patterns in the energy and frequency data and comparing these with logs provided by G11 resources. A further five sites were re-processed from the 2010 study.
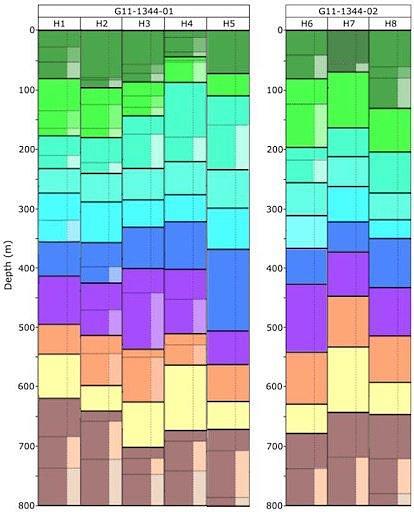
Mineralogical data was also provided by G11 resources. Adrok was also able to estimate the mineral percentage in the key lithology units.
The processing methods were also applied to the data collected in 2010. Four of the sites were different to those collected in 2018.
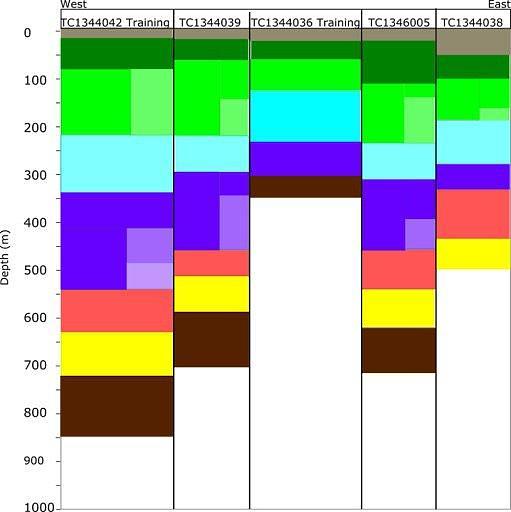
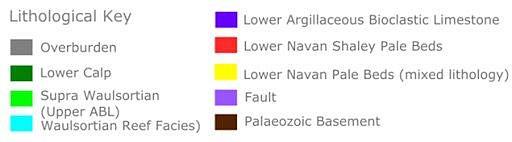
The data was then combined into a 3D grid and where possible and interpolation produced across each of the sites. This to some extent was useful for identifying where potential faults might be
The results were then compared with previous models provided by G11.
Benefits for client
The main benefits to the client were the quick turnaround of results to the client, the low impact on the environment of the surveying and the identification of key lithological units including those where zinc and lead might be found.
DELINEATING FAULTS AND LITHOLOGICAL BOUNDARIES USING REFLECTED ENERGY
PROJECT RESULTS REVIEW FOR SULFIDE DELINEATION AT BALLINALACK, IRELAND
SEDIMENTARY-HOSTED LEAD-ZINC TARGETING IN THE CENTRAL IRISH BASIN, IRELAND
