
European Association of Geoscientists and Engineers, 2009

Invisible ADR light recognition of subsurface rocks and rock successions G.C.Stove*, J.McManus, M.J.Robinson*, G.D.C. Stove*, A.W.Odell* *Adrok Limited
Abstract
When pulsed electromagnetic radio-waves pass through a material they generate measurable responses in terms of energy, frequency and phase relationships. Following early applications of Atomic Dielectric Resonance (ADR) investigations in medical studies 1, 2 the technique was extended to an exploration of the penetration of invisible laser light into minerals and rocks, each of which showed characteristic responses. A deployment of the ADR equipment in a field study of a measured section of Namurian sediments in a disused quarry at Cults, Fife, has confirmed the ability of the method to distinguish the nature, thickness and depth of the rock units present. Recognition of limestones, sandstones, mudrocks and coals has been achieved. The signal penetrated more deeply into the ground than the height of the exposed rock section. However, it showed good correlation with records from nearby boreholes which extended to lower levels, suggesting that lithological recognition at ground penetration of more than 90 m had been achieved.
Atomic Dielectric Resonance (ADR) 1, 2 is a recently patented investigative technique (US 6864826 B1 and EP 1 210587 B1)3 which involves the measurement and interpretation of resonant energy responses of natural or synthetic materials to the interaction of pulsed electromagnetic radio-waves, micro-waves, millimetric or sub-millimetric radio-waves from materials which permit the applied energy to pass through the material. The resonant energy response can be measured in terms of energy, frequency and phase relationships. The precision with which the process can be measured helps define the unique interactive atomic or molecular response behaviour of any specific material, according to the energy bandwidth used. ADR is measurable on a very wide range of hierarchical scales both in time and space. Time scales may range from seconds to femtoseconds, and spatial scales from metres to nanometres.
The method was developed some 20 years after initial tests using remote sensing techniques with X-band (30mm) and C-band (55mm) waves in an aircraft-based synthetic aperture radar investigation with the European Space Agency. Within that study it was recognised that more than the expected very limited ground penetration (1.5cm and 3cm respectively) of beach sands was being achieved. The surface of the ground water table was clearly recognised some 3m below the ground surface (and confirmed by boreholes) across the Sands of Forvie, near the mouth of the Ythan Estuary, in Aberdeenshire. One year later this greatly enhanced depth of penetration was seen in Space Shuttle L-Band imagery of the Sahara Desert, where L-band waves (23cm) were seen to penetrate some 3m below the Sahara desert floor and reveal ancient river beds.
In recent years, the technology for the production of laser light has become widely available, and applications of this medium to the examination of materials are constantly expanding. Whereas the earlier applications concentrated on the use of visible laser light, the development of systems using invisible laser light are now being further explored. In this contribution we wish to report on a series of experiments in which rocks of different compositions and textures have been exposed to pulsed beams of wideband conditioned ADR radiation, producing a range of differing energy and frequency responses detectable by suitably conditioned receivers. Conditioning the beam by dielectric optics creates a synthetic lens effect so that the sensors appear to have much longer chambers with wider apertures. This effect produces narrow coherent beams of pulsed and lased radiowaves which are good for illuminating target interfaces and materials.
The conditioned ADR beam of photons penetrates the rock and as it encounters the component materials it stimulates the atoms to release energy according to their compositions. The conditioned pulse of photons passes through the structure of the atom and emerges to encounter more atoms further along its path. Electrons from each individual atom release energy in all directions, and by timing the first arrival of this burst of low energy from a time-zero position beside the transmitting source, enables the distance to the responding atoms encountered to be determined. The nature of the return signal, its frequency and energy levels and phase changes (if any) are determined by the minerals encountered. In a rock mass the component minerals may vary, but in general, sandy rocks are composed principally of quartz (SiO2), limestones mainly of calcite (CaCO3), coals largely of Carbon (C), and clays or shales mainly of assemblages of iron- or magnesium-alumino-silicates. Cascading harmonic analysis of the emerging electromagnetic radiations, enables the energies and frequencies of the signals released by the materials to differ sufficiently for the rock compositions to be recognised by computer processing. We have found that by repeated characterisation of the ADR signals received from known rocks at known depths in quarries or boreholes, it has been possible to classify the principal rock types of Central Scotland and identify them with confidence in blind tests beside logged boreholes.
After several years of preliminary work the ADR equipment has undergone sufficient development to allow extended testing of materials in the field. Initial tests have been carried out using wide-band conditioned pulses between 1MHz and 100MHz at a series of sites in Central Scotland. In this contribution, we report on a series of findings from a quarry at Cults, Fife (NO353089). In addition to detailed findings at Cults we have also done work in Fife from profiling along the A915 road in the East Fife Coalfield (NO465093), beside a deep borehole at Rashiehill, near Slamman in West Lothian (NS730840), and from a ship-board deployment on traverses of a coalfield beneath the Firth of Forth. More recently, the equipment has been successfully deployed at other sites in the UK and overseas.
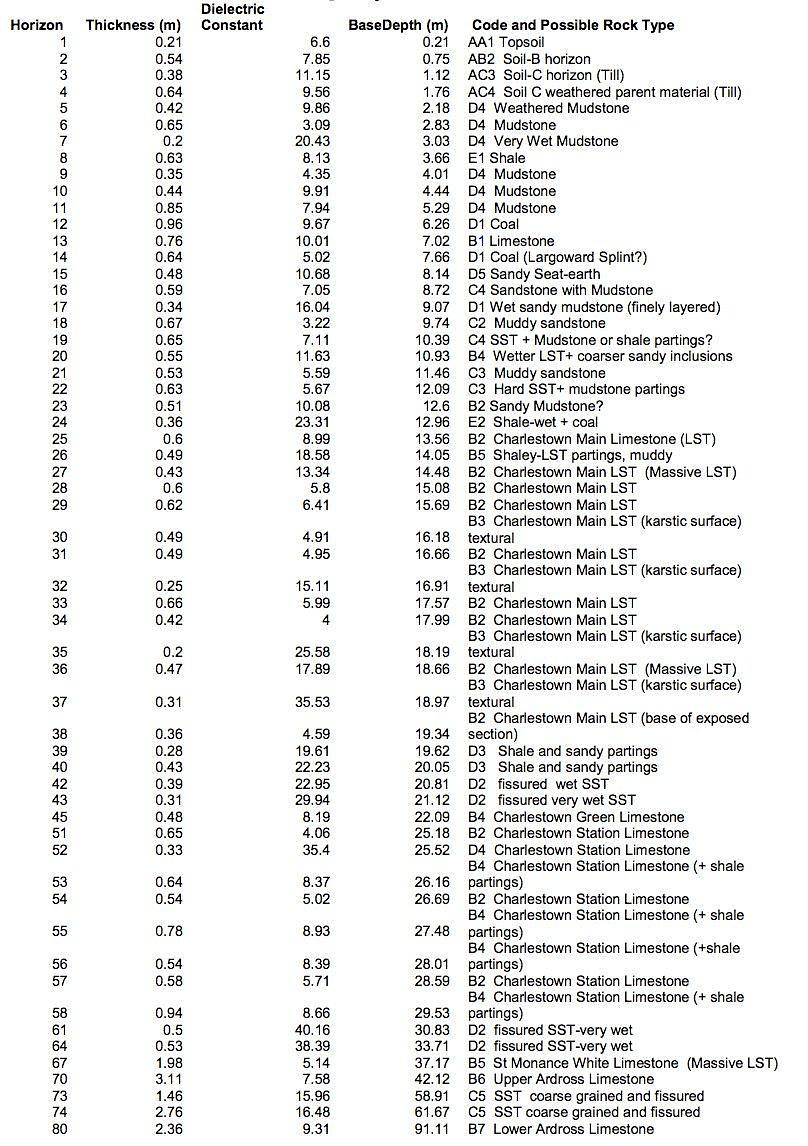
At Cults, the system was deployed shooting vertically downwards into the ground along a 20m traverse line, 7.6m behind the crest of a 19m high quarry face, from which a detailed log of the exposed succession of the horizontal sedimentary rocks had been measured. Signal responses were collected at 2cm intervals along a traverse line from east to west and then reversed, from west to east. Regular electronic fixes were recorded at 1m intervals to allow the scan lines to be horizontally rectified, if there was any variability in the scanning speed. Both traverses were repeated, consistent results being obtained. For triangulation, Wide Angle Reflection and Refraction (WARR) scans were than carried out in both directions along this traverse. In this mode of data collection, the receiver is placed at chainage 0m at the start of the East to West line and the transmitting sensor is moved from east to west for the full 20m length of the traverse. This enabled a reflection and refraction profile to be obtained over the first half of the traverse length (i.e. from 0m to 10m in chainage). The reverse scan, with the receiver positioned at Chainage 20m and the transmitting antenna moving from chainage 20m to chainage 0m, enabled a reflection and refraction profile to be obtained over the second half of the traverse from 20m to 10m in chainage. Triangulation of each interface was enabled by ray tracing and Normal Moveout (NMO) computations, similar to the methods used in the seismic industry. This allowed WARR tables listing depths, layer thicknesses and inter-layer dielectric constants for each distinct rock layer (with differing transmission velocities) to be produced. The processed ADR signal after WARR analysis and the measured section are shown in Table 1, where alphanumeric codes have been allocated to the rocks according to their interpreted compositions. The signals showed consistent similarities between the limestones, between the mudrocks, between the coals and between the sandstones at known depths determined from the exposed quarry face.
The quarry, which is a RIGS protected site, had been disused for several years prior to the study. The detail of the exposed Visean succession, as originally outlined by Geikie4, reveals two almost complete cycles of deposition. At the base of the face, is the massive Charlestown Main (Blackhall) Limestone, comprising several thin beds of limestone, several of which are separated by ancient karstic surfaces. Some 5.7 m above this are two thin coal seams with their attendant seat- earths. Between them lies a thin limestone horizon, as noted by Geikie4. The two coal seams may be the equivalents of the Largoward Black Coal, which, in the Drumcarrow Borehole, 11km to the east, Forsyth and Chisholm5 showed to consist of two closely spaced units at about the level of the Seafield Marine Band, 15 m below the Lower Kinniny Limestone. Separating most of these units are mudrocks and muddy sandstones (Horizons 9-11, 16, 17, 19 and 22 in Table 1). Several water- saturated horizons are present (Horizons 7, 17, 24 and 26 in Table 1). The coals and the Charlestown Main Limestone have been worked in the neighbourhood. From the upper part of the record, for which there is confident identification of the rock types it is evident that the dielectric constant increases with the water content of the rocks. The dry mudrocks show dielectric constants of 3.09 to 9.91, averaging 6.26, whereas their wet counterparts ranged from 9.86 to 23.31, averaging 17.41. In the Charlestown Main Limestone the dielectric constants for the mass of the rock ranged between 4.00 and 17.89, averaging 7.65, whereas in the texturally altered limestones with karstic features they varied from 13.34 to 35.53, averaging 22.31.
The ADR signal actually penetrated much deeper than the exposed quarry face, where the identities of the sediments concerned were well defined. Several further cyclic sequences of flat-lying sediments appear to be present beneath the floor of the quarry. The records of boreholes put down by the British Geological Survey in 1994 (Cults No 1 and Cults Farm)) some 300 and 400 m to the northwest of the quarry respectively confirm the presence of further cyclic sequences at approximately the heights detected from the above quarry face. Four limestone horizons, believed to be the Charlestown Green (Horizon 45 in Table 1), Charlestown Station (Horizons 51 to 58 in Table 1), St Monance White ( or Blackbyre, Horizon 67 in Table 1) and Upper Ardross Limestones (Horizon 70 in Table 1), have been identified, the latter three levels coinciding with those recorded in the borehole logs. One further suggested bed of limestone, possibly the Lower Ardross Limestone (Horizon 80 in Table 1), appears to be present below the Upper Ardross Limestone but in the absence of exposures or more deep boreholes this identity cannot be confirmed.
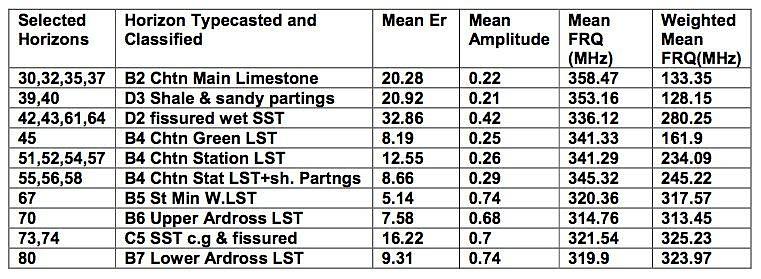
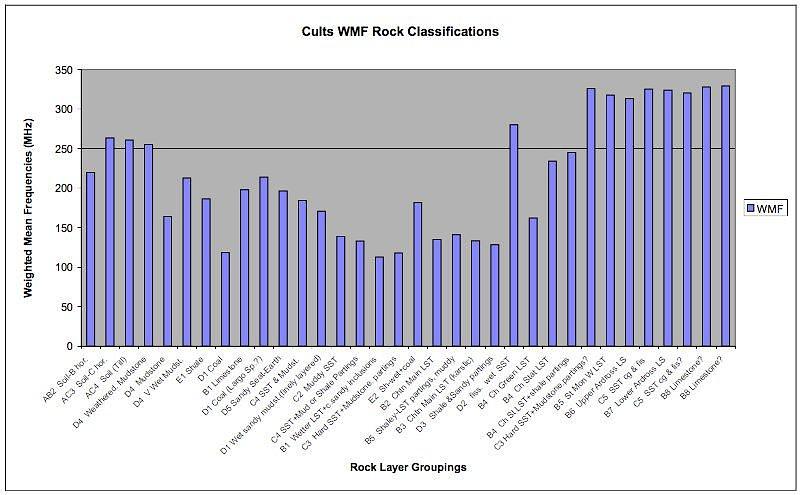
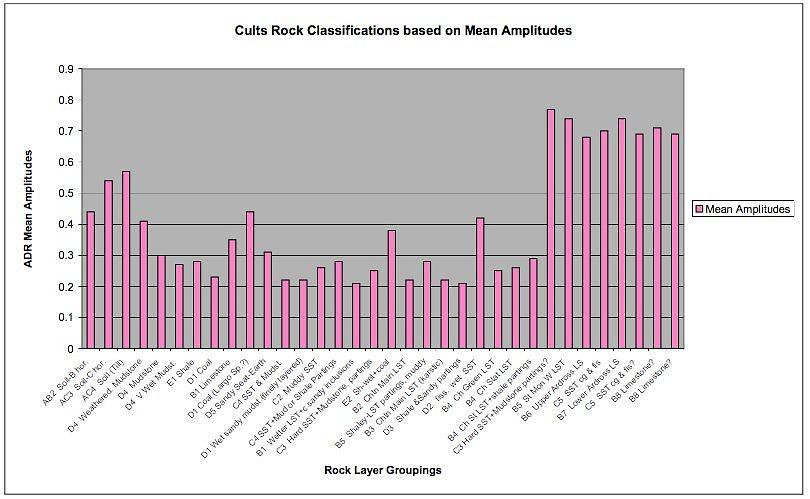
If selected horizons from Table 1 are sub-sampled and average parameters calculated and listed as in Table 2, then some significant correlations can be evaluated. These exist between Mean Amplitudes and Mean Frequencies and Mean Amplitudes and Weighted Mean Frequencies (Fig 1, Fig 2). For example, the correlation between Mean Amplitude and Mean Frequency for the 10 consecutive horizons averaged from the Table 1 layers is -0.9510, which is an inverse correlation but is significant at the 0.001% level or 99.9 confidence level for (n-2) = 8 degrees of freedom where this value greatly exceeds the tabulated value of 0.8721 (Table VII, Fisher and Yates6). The correlation between Mean amplitude and Weighted Mean Frequency is +0.8937, which is a positive correlation and is again significant at the 99.9% confidence level for 8 degrees of freedom. Finally, if the correlation between Frequency and Weighted Mean Frequency is evaluated it is seen to be another inverse relationship of -0.9091, which is again significant at the 99.9% confidence level. This result would suggest that these ADR parametric relationships could be a significant way of identifying the rocks sampled in Table 2.
Further ADR field deployment has been undertaken at other sites in the UK and overseas. Preliminary databases have been established for the principal igneous, metamorphic and sedimentary rock types of Scotland. These databases, which have been confirmed, by comparison with new scanned sections and driven boreholes, offer considerable potential for future geological exploration.
- Fagge, T.J., Barclay, G.R., Stove, G.C., Stove, G., Robinson, M.J., Head, M.W., Ironside, J.W. and Turner, M.L. 2007 J. Translational Medicine, 5:41
- Valentine, H., Fraser, J., Stove, G.C., Barclay, G.R. and Farquhar, 2002 C.F. Atomic dielectric resonance spectroscopy: a novel technique for the identification of TSE infected tissues. Proc. Int.Conf. on Transmissible Spongiform Encephalopathies, Edinburgh 9.
- Stove, G.C., Radar apparatus for imaging and / or spectrometric analysis and methods of performing imaging and / or spectrometric analysis of a substance for dimensional measurement, identification and precision radar mapping. 2005, 10/ 070,768: 1-37. Edinburgh, GB
- Geikie, Sir A. Memoir of the Geological Survey of Scotland. The Geology of Central and Western Fife and Kinross. 1900, HMSO, 284pp.
- Forsyth, I.H. & Chisholm, J.I. The Geology of East Fife. 1977 HMSO. 284pp.
- Fisher, R.A. and Yates, F. Statistical Tables for Biological, Agricultural and Medical Research, 1963, 6th edition, Oliver and Boyd, Edinburgh.
