
Summary
The lack of modern mining in Charters Towers is linked to the difficulties associated with accurately pinpointing high-grade gold-bearing lodes on host fractures. A geophysical survey of the Charters Towers area has been carried out by ADROK using a non-destructive, non-invasive surface-based technique termed Atomic Dielectric Resonance (ADR). A vertical log is generated for selected sites and the resonance energy (E-ADR) used to pinpoint sulphide bearing lodes within granitic host rocks below the site. Preliminary results show that the technique can successfully pinpoint sulfide and associated gold mineralisation to a depth of up to 1000m. A total of nine scans or “Virtual Boreholes” over three main ore-bearing fractures in Charters Towers have correctly identified the depth and presence of known sulfide ore zones with a maximum depth error of 13m. In some scans, the presence of anomalies at unexpected depths are interpreted to represent potential sulfide targets. The ADR technique is particularly useful in Charters Towers, for example, where other techniques such as TEM, magnetics, gravity or seismic reflection surveying cannot be used due to access or other anthropogenic factors. Results so far indicate that the technique represents a significant advance in the pre-drilling identification of target sulfides.
Key words: Atomic Dielectric Resonance (ADR), Adrok, gold exploration, virtual borehole, Charters Towers.
Introduction
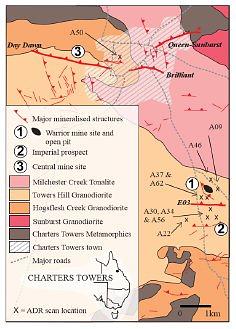
The Charters Towers gold field located in NE Queensland, Australia is one of the richest gold fields in Australia having produced over 7 million ounces of gold since discovery in 1872 (Figure 1). Approximately 6.6 million ounces of gold were extracted from underground over the main period of mining that extended from discovery in 1872 until near closure of the field in 1917. Since 1917, several major companies including Western Mining, Homestake-BHP, Normandy-Mt Leyshon, CRA and Gold Mines of Australia have held exploration licenses over parts of Charters Towers and all have carried out major phases of exploration. However, none of these companies have been successful in pinpointing an economically viable deposit. Citigold (formerly Charters Towers Gold) is the only company to have successfully operated large-scale open pit and underground mines in Charters Towers since 1917 with a total production of over 100,000 oz. of gold.
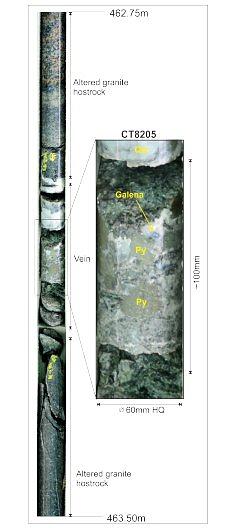
The Charters Towers goldfield is characterised by narrow vein style mineralisation. Gold and associated sulfides (galena, pyrite and sphalerite) occur as discontinuous pods or lenses of massive sulfide within narrow (< 2m thick) quartz-dominated veins (Figure 2). The veins themselves are hosted almost exclusively within a few granite plutons that range from tonalitic to granodioritic in composition (Figure 1). An alteration zone of chlorite, sericite and epidote is present in the hanging and foot wall of the mineralised structure but typically penetrates just a few meters into the granitic host rocks.
The geometry of the fractures and associated veins hosting the mineralisation is relatively consistent across the gold field. The largest structures such as the >2 Moz Au Brilliant Reef trend approximately east-west and dip to the north between 40 and 60 degrees (Figure 1). Higher grade structures (up to 8 oz/t Au) structures are characteristically shallow dipping to the north-east (< 45 degrees) and contain less tonnes. Both types of structure are targets for exploration but the style of mineralisation negates the use of typical exploration methodologies.
The high-grade mineralisation occurs as pods and lenses that are typically less than 50m in the longest dimension and less than 1m in thickness. The small size of the lenses combined with the target depth of mineralisation at over 300m limits the use of more traditional exploration techniques. Several geophysical methods have been intensively tested by Citigold including TEM, down-hole EM, IP and borehole radar but none have successfully defined a target. In addition, the deposit lies directly below the town of Charters Towers (Figure 1) which, due to difficulties associated with access and infrastructure, renders most of these techniques useless. To date, only drilling has successfully identified a mineable, sub-surface high-grade ore pod.
In September 2013, Citigold trialled the Atomic Dielectric Resonance (ADR) method offered by Adrok. The ADR technique utilises specialized equipment used to transmit radiowave and microwave energy. The transmitted energy, rather than being rapidly absorbed like unconditioned electromagnetic waves, passes through most materials (it has problems with dense metallic masses). As it travels it causes the electrons it strikes to resonate in a characteristic manner. This resonance releases energy which is transmitted in part back to a surface detector. A spectral response can be gained from the return transmission because the resonant energy of the signal is analyzed and compared with a library of known patterns, to give a material classification that resembles a “Virtual Borehole Log”, showing, for example, lithology by depth. Depths are classified according to a time base just as in a radar scan; the longer the return time of an “echo”, the deeper the target. Data resolution is many times greater than acoustic imaging methods such as seismic or ultrasound, or other radar imaging such as ground penetrating radar (GPR). Adrok’s technology measures subsurface (a) dielectric permittivity; (b) spectral (energy, frequency and phase) and (c) material resonance, from ground level, without physically boring the ground.
The ADR technique is also non-invasive and therefore suitable for use in a populated area such as Charters Towers. The energy employed is very low (less than a watt), and the waves generated are non-destructive, so there is no detectible chemical or biological change in the materials under investigation.
Preliminary results show that the technique has the capacity to correctly identify sulfide mineralisation hosted by narrow vein structures and therefore represents a significant advance in geophysics where access or deposit type limits the use of other techniques. Results from pre- and post-survey diamond drilling confirm the target anomalies identified using the ADR technique and support the geological interpretation that significant gold-bearing lodes exist beneath Charters Towers.
Methods and results
Methods
1. ADR methodology and data processing
Energy logs and the harmonic data sets are generated by conducting a “stare scan” whereby the Transmitter and Receiver Antennas are placed stationary at a fixed point, spacing of 300mm between Transmitter and Receiver sensors, with apertures at an elevation of 400mm above the ground. At each site, four stares were conducted, two with both antennas attached, a third where only the receiver was active and fourth where neither the Transmitter (Tx) nor Receiver (Rx) were active.
Three independent statistical variables are selected for the harmonic analyses. The mean energy (E-Mean), resonance energy (E-ADR), and reflective energy (E-Gamma) responses are measured over a chosen harmonic number (frequency) range selected to highlight the unique signal response of the material. Similar statistical measurements are made regarding the frequency responses (F-Mean, F-ADR and F-Gamma).
An energy log (E log) of the energy returned back to the ADR receiver from the subsurface reflections from the Earth’s Crust is calculated. The E log is produced by sub-sampling the Stare scan image data in equal time intervals. A Fourier Transform is conducted on each sub-image, whereby the energy and frequency content is computed. A mean energy decibel value is calculated for each sub-image, which provides the energy reading at that depth.
2. Rock types suitable for distinction
The ore lodes at Charters Towers are well suited to the ADR technique. As described, the massive sulfide lenses are enclosed within quartz, altered granite and a relatively uniform host granodiorite to tonalitic rocktype. The dielectric properties differ markedly between these two types. Adrok’s technology can be trained on known geology to build up a reference database against which to correlate data collected from new, unknown locations. For this geophysical survey Adrok collected data within an area that has several physical drill holes, and has been allowed access to borehole logs from these holes. Adrok found that the dielectric properties of the rock types and the energy responses of the rocks and minerals were distinctive and could be used to classify the different rock layers and mineralisation zones.
The dielectric measurements are an index of the rate of transmission of the ADR radiowave-lased beam through a medium relative to the transmission rate of the beam through air. This is also sometimes called the Transmissivity Index. Air has a dielectric constant of 1(ϵr). For a medium such as limestone the dielectric constant (ϵr) is typically 9.
3. Data presentation
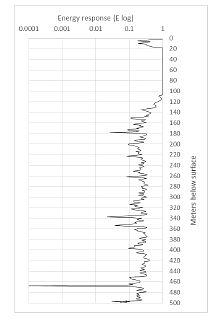
Results for only the Energy Log (E-log) are presented here. The E log results are presented on a log scale, with values of less than 0.01 considered as anomalous and therefore significant and indicative of target sulfides. In some scans, multiple values of < 0.01 were identified suggesting more than one ore-bearing target.
4. Selection of ADR scan locations
Sites were selected based on a few simple criteria including: 1) adjacent to an existing vertical drill hole where the geology and intercept grades were known, 2) where post-ADR drilling was to be completed soon after data acquisition, 3) in areas where mineralisation is known to exist from Citigold’s underground mining operations or, 4) in areas where the depth to the intercept is inferred but the presence of sulfides had not been definitively proven.
Scan A09 was used for equipment calibration and was completed adjacent to an existing vertical diamond drill hole where sample assays and a complete geological log were provided to Adrok prior to processing of the data. In all other cases, the geology and target depth were unknown to Adrok until after processing had been completed. In one case a single vertical diamond drill hole (CT8205) was drilled parallel to the ADR scan (scan A56) to test the accuracy and significance of anomalies identified in the pre-drilling scan; the results from this scan are presented in detail below. Scans A37 and A62 were carried out over areas where mineralisation was known from underground mining carried out by Citigold immediately below the scan collar location (Figure 1).
Results
The results from 9 “Virtual Boreholes” are discussed below with the results from a single hole (A56) presented in detail.
Three main areas were selected to test the ADR technique: Central (ADR scan A50), Warrior (ADR scans A09, A48, A62, A84) and Imperial (ADR scans A22, A30, A34 and A56) (Figure 1). At each location, the ADR method accurately identified the location (depth) of the sulfide-bearing structure.
The maximum difference between the expected depth of a sulfide structure and the anomaly in the ADR scan was 13m. This result was found in ADR scan A84 which recorded an anomaly in the E log plot at 365m while the associated diamond drill hole (CT3067) exhibited a high grade sulfide intercept at 378m. Other scans where diamond drilling or underground operations could constrain the exact depth of the sulfides were within 5m error and typically within less than 2m. Initial results indicate that the variability may be influenced by the thickness/width of the intercept and the lead grade of the sulfides within the intercept.
Drill hole (CT8205) and ADR Scan (A56)
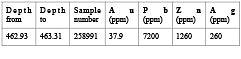
Diamond drill hole CT8205 was drilled after acquisition of the ADR data. Presented below is the return energy plot for ADR scan A56 (Figure 3). The principal anomaly in the scan occurs at -467.91m below surface. Other minor anomalies in the scan between 0.01 and 0.1 occur at approximately 178m, 338m and 456m. Assay results from the parallel diamond drill core confirm a high-grade sulfide intercept at 463m down hole (Table 1).
Scan A56 and parallel drill hole CT8205 were completed as part of a four-scan survey over the north-dipping Imperial structure. Two scans, A30 and A34 were completed in the same area as A56 presented above (Figure 1). The ADR results show the presence of two possible sulfide bearing structures. These results differed from the existing structural interpretation of the area which showed only one north-dipping structure. Post-ADR drilling in the area has confirmed the presence of two structures, both of which contain sulfide mineralisation. In addition, scan A30 contains an unidentified, undrilled anomaly at approximately 800m depth. A fourth scan (A22) was completed to the west of the interpreted Imperial structure in an area where no drilling has been carried out. The scan returned an anomaly at a depth that fell within just a few meters of the inferred depth of the structure.
Four additional scans were completed at the Warrior mine site (Figure 1). Two scans A62 and A84 were carried out in areas where part of the high-grade sulfide ore zone had not been removed during underground mining operations. In both scans, the anomaly was within 13m of the known ore zone. In addition, both scans exhibited a second anomaly approximately 60-80m shallower than the target structure. A re-examination of drill hole data after the ADR results were obtained revealed that the anomaly in the ADR data corresponds with high-grade intercepts in an as yet un-defined structure that lies above the target structure. Drill hole intercepts on this unidentified structure include gold assays of 370g/t (CT4045), 15.2 g/t (CT4038) and 34.8 g/t (CT2088).
Scan A48 was carried out to the north of the Warrior mine site (Figure 1). The ADR data was processed to a depth of 1000m below the surface with the results returning two significant anomalies. The most significant anomaly occurred at 884m which is consistent with the inferred down-dip extension of the north-dipping E03 structure presented in Citigold’s Mineral Resources and Reserves Report (Towsey, 2012). The second anomaly in the ADR scan occurs at 675.5m and is an unidentified structure.
The only scan completed and analysed in detail in the Central area is A50 (Figure 1). The ADR data was processed to a depth of 1000m and aimed at pinpointing the down-dip and western extension of the 2.2 Moz Brilliant Reef. The deeper of the two anomalies at -710m fell within 1m of the inferred structure surface published in Towsey (2012). The anomaly at 220m below surface has not been drilled and remains as a potential target.
The results of the survey are preliminary and further drilling is being carried out to confirm significance of the ADR anomalies. Nevertheless, the surveys completed so far indicate the ADR can be used prior to drilling to identify sulfide-bearing fractures.
Conclusions
Charters Towers is one of the highest grade gold deposits in Australia but the style of mineralisation and the position of the deposit below a large country town negates the use of many geophysical techniques. Results from the Atomic Dielectric Resonance (ADR) survey carried out by Adrok has demonstrated initial success in identifying sulfide ore pods and lenses within large planar fractures that characterise the Charters Towers area. All of the ADR scans completed at the time of writing correctly targeted the ore-zone within the target structure. The anomalies presented in the ADR data exhibited a maximum error of 13m.
Ongoing testing of the method is underway with several parallel drill holes to be completed where ADR scans exhibit anomalies indicative of sulfide targets.
The style of mineralisation in Charters Towers, that is, pods of massive sulfides in a relatively uniform granitic host, make it ideally suited to the ADR technique due to the distinct difference in dielectric properties of sulfides versus the granite.
- Towsey, C.A.J., 2012, Mineral Resources and Ore Reserves 2012 Charters Towers Gold Project for Citigold Corporation Limited. Pathfinder Exploration Pty Ltd. 173 pp.
