
Our scanner works with a unique combination of physics, mathematics and technical innovation.
Dr Colin Stove, the founder and inspiration behind the Adrok ADR Scanner, had a distinguished career in the field of radar – working with radar sensors from both satellites and the Space Shuttle, as well as working extensively with ground penetrating radar.
This fundamental understanding of wave and light physics gave him the insight and knowledge he needed to successfully reinvent the subsurface scanner using an advanced ‘coherent’ beam (two waves working together), that has worked so effectively, it is fundamentally changing the way the exploration industry works.
ADR technology was developed through empirically driven research and validated through field applications.
Why Atomic Dielectric Resonance?
The first three letters of our name A. D. R. stand for ‘Atomic Dielectric Resonance’. And this phrase is the key to how the scanner works. This is what we create and what we interpret. We measure ‘dielectric resonance’, which is the unique way materials resonate when hit by electromagnetic waves.
How Adrok's ADR technology works?
🔁 Deploy ADR scanners → Capture subsurface data → Analyze results → Make actionable decisions.
Our technology delivers real-time insights that guide your projects safely, efficiently, and sustainably
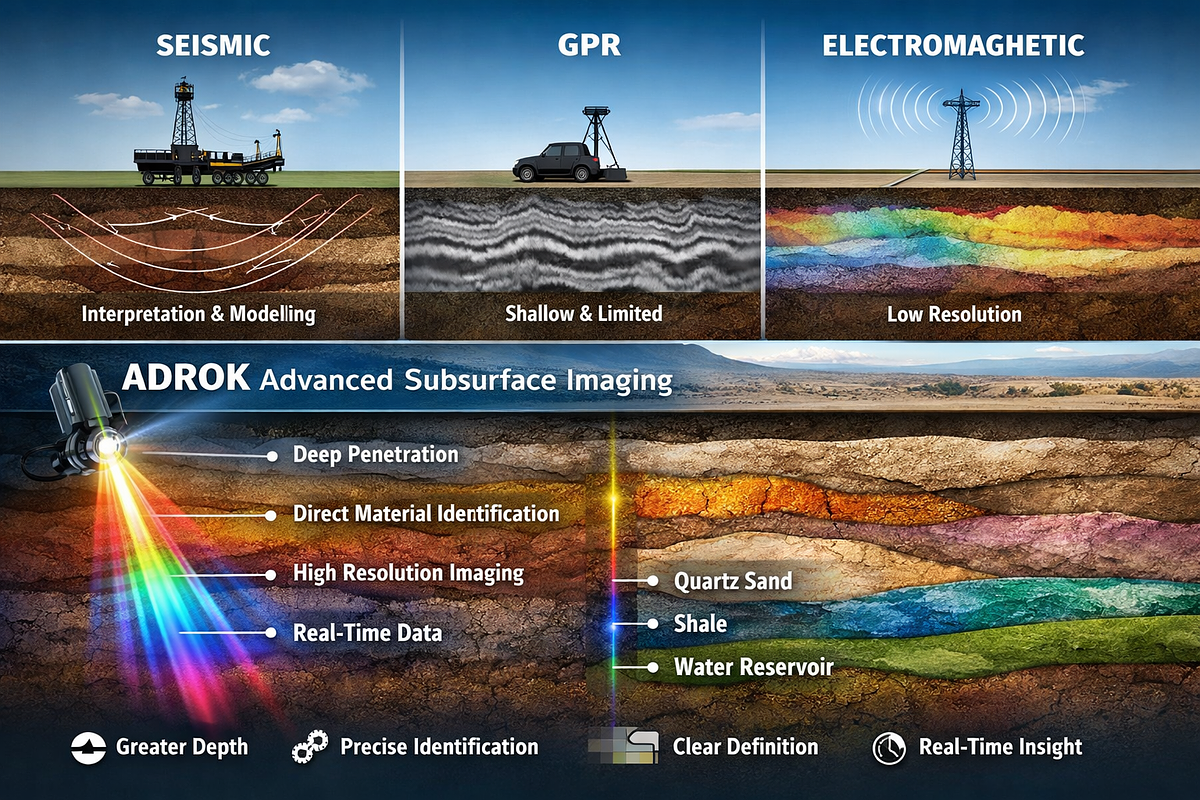
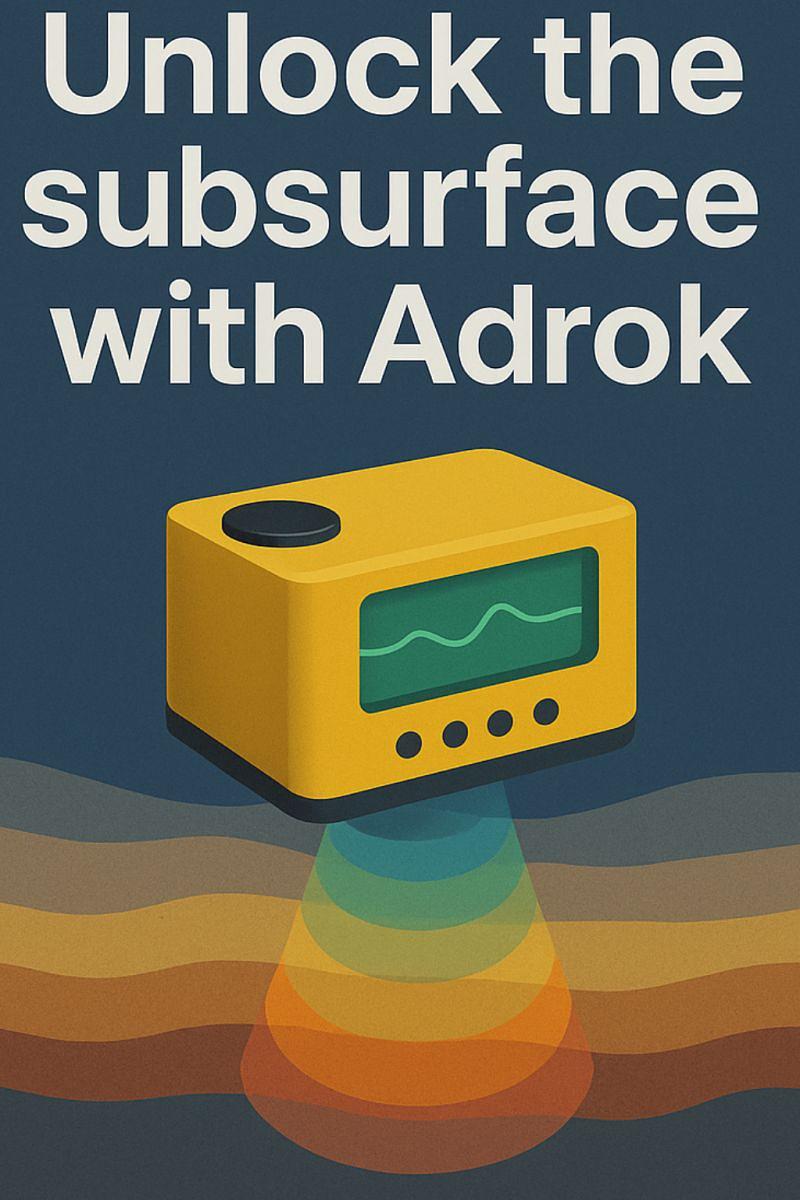
Adrok's scanner uses Atomic Dielectric Resonance (ADR)—a technique that transmits narrow pulsed beams of micro and radio waves into the ground. When these waves cross boundaries between different material types, an "echo" reflects back to the scanner.
The key principle is that every material has a unique dielectric permittivity—essentially its "resistance" to electromagnetic waves. The reflected signal comes back with a slightly different resonance than what was transmitted, creating a signature as distinctive as a fingerprint. By analyzing these echoes, Adrok can identify what materials are present and map their depth, shape, and extent.
The transmitted wave packet contains multiple frequency components (roughly 1–100 MHz):
- Low frequencies achieve deep penetration
- Higher frequencies enhance vertical resolution
This combination allows the technology to produce what Adrok calls "Virtual Boreholes"—detailed subsurface profiles without physical drilling.
The Adrok scanner transmits and then receives back, narrow pulsed beams of micro and radio waves. When these waves cross a boundary between material types, an ‘echo’ is reflected back to the scanner.
But the ‘echo’ that is received is different to the one that was sent out. It has a slightly different resonance. Why? Because a material has its own Dielectric Permittivity – or ‘resistance’ to the electromagnetic wave that we hit it with - think of it like pouring water on a variety of household objects - all will absorb and repel the water in a different and unique way depending on what it is made of.
This ‘echo’ is as unique as a fingerprint, and can then be analyzed to reveal detailed information on the characteristics of the material that has been discovered.
Because the micro and radio waves are both absorbed and reflected by materials, we can also obtain accurate measurements of the shape and depth of the materials scanned (effectively a map).
Based on available case studies and industry feedback, Adrok's ADR technology has proven to be an effective tool for subsurface exploration across multiple sectors. Its non-invasive nature, cost efficiency, and high-resolution capabilities make it a valuable alternative to traditional exploration methods.
Predrilling Virtual Logging ®.
Its Less Boring with Adrok ®.
Sustainably Extending Resources Life™
📚 Download our ADR Technical White Paper for more information
Some frequently asked questions about our technologies?
Q1. What is Atomic Dielectric Resonance (ADR) technology?
ADR technology is a geophysical method developed by Adrok that uses electromagnetic waves to penetrate the Earth's subsurface. This non-invasive technique allows for detailed imaging of geological formations, providing accurate data for various applications such as mineral exploration, oil and gas detection, and environmental studies.
Q2. How does ADR technology work?
ADR technology works by emitting electromagnetic pulses into the ground. These pulses interact with subsurface materials and generate responses that are recorded and analyzed. The data collected is used to create detailed images of the subsurface, revealing different geological layers and structures.
📚 Learn more about Adrok's deep penetrating ADR Technology
Q3. How accurate is ADR technology in identifying subsurface formations?
ADR technology provides high-resolution imaging and can differentiate between various subsurface materials with a high degree of accuracy. The precision of ADR has been validated through numerous field tests and case studies across different geological settings.
Q4. What is the environmental impact of ADR technology?
ADR technology is designed to be environmentally friendly. Since it is non-invasive, it minimizes the disruption to natural landscapes and ecosystems. This makes it a sustainable choice for subsurface exploration compared to traditional methods that require extensive drilling and excavation, power consumption, vibrations, transportation and logistics.
Q5. How does ADR technology contribute to cost savings in exploration projects?
By providing accurate subsurface data without the need for extensive physical sampling, ADR technology significantly reduces exploration costs. The fast turnaround of data and high-resolution imaging also streamline the decision-making process, leading to more efficient project planning and execution.
Q6. Can ADR technology be used in remote or difficult-to-access areas?
Yes, ADR technology is highly versatile and can be deployed in various terrains and environments, including remote and difficult-to-access areas. Its non-invasive nature and portability make it ideal for challenging exploration sites.
Q7. What kind of data outputs can clients expect from an ADR survey?
Clients receive detailed subsurface logs, images and data reports that include information on geological formations, material composition, and potential resource locations. The outputs are presented in a user-friendly format, often accompanied by 3D visualizations to aid interpretation.
Q8. How does Adrok ensure the reliability and accuracy of its ADR surveys?
Adrok employs rigorous quality control and validation procedures to ensure the reliability and accuracy of its ADR surveys. This includes calibration of equipment, thorough data analysis, and cross-referencing with existing geological data. Additionally, Adrok continuously invests in research and development to enhance the capabilities of ADR technology.
Q9. Do we emit a narrow beam as a laser?
No, as our deeply penetrating centre frequency has a wavelength of about 30metres the narrowest possible beam would be about 10 times wider than the wavelength because of Huygens' principle. However we do use beam modelling (a form of raytracing) in our analysis and some forward models.
Q10. With a wavelength of 30m don't we have an error of 30m in feature localization?
This is true if we used a single photon. If N photons are used the theoretical error is 30m/sqrt(N). Classically we use phase information to accurately locate a reflector. In practice accuracy is limited by sampling rate, and not the theoretical limit as N is of course very large.
Q11. Doesn't Maxwell's equation predict radio waves don't penetrate?
Maxwell's equations govern electromagnetic phenomena in vacuum only. To model propagation in materials such as the earth a specific model of the electrical properties of the earth has to be created and then coupled to the Maxwell equations. Such models are phenomenological and usually have several parameters that are difficult to measure in-situ. Download our technical note on the propagation and attenuation of EM waves in complex media for further technical explanations. Also here is a research project that demonstrates our signals' two-way reflection propagation through 1.1km of rock to ground level from inside one of Europe's deepest underground mines.
Q12. Can't we just measure the electromagnetic properties of rocks in the lab and then use that in a forward model for subsurface propagation?
When material is removed from the ground atmospheric contamination (mainly moisture) changes the electrical properties, so these values are not the in-situ values governing propagation. Apparently Erwin Schrödinger, one of the founders of Quantum Mechanics, measured such changes for his thesis and found the resistivity can change by many orders of magnitude. As a consequence the attenuation of the EM waves in the ground as predicted by ground model parameters obtained in the lab from rock samples often displays strong attenuation, whereas field measurements show wave propagation with much less attenuation. We have performed in-situ measurements of attenuation at selected locations and found that when in-situ experimental data is used the attenuation is several orders of magnitude less than predicted by “book” values. Details can be found in SEG2014 conference paper (Doel et al, 2014) and CSIT2018 peer-reviewed journal paper (Doel & Stove, 2018).
Q13. Why do some geophysicists say that this technology does not work?
Cognitive biases and uncertainty (incomplete understanding) may be at play. Have you asked them whether they have tested or used our technology first-hand before? The likelihood is that they have not bothered; which clearly does not mean that our technology does not work or will not be successful. They are not basing their view on a single failed experiment or any actual real-world facts. There are many geophysicists with vested interests in the geoscience industries who become nervous about competition and do not like new ideas or new technology generated by others, as it may adversely affect their own positions and reputations. It only endorses Adrok as a legit alternative to their own offerings: if they did not think that was the case, then they would not snipe or say anything.
At Adrok we have no interest in besmirching competitors and their technologies; we believe this is unprofessional, immature and benefits nobody. We appreciate how difficult it is to create new technologies and bring them to market. Evaluations of any new technologies should start with a "Fair Go".
As Sir Arthur Charles Clarke stated - Every revolutionary idea — in science, politics, art, or whatever — seems to evoke three stages of reaction. They may be summed up by the phrases:
(1) "It's completely impossible — don't waste my time";
(2) "It's possible, but it's not worth doing";
(3) "I said it was a good idea all along."
Opportunities are found where the speed of scientific and technological innovations outpace the rate of Humans' adaptability to change.
And, as Jeff Bezos stated - "you have to be willing to be misunderstood if you're going to innovate".
Q14. What is the typical process for conducting an ADR survey with Adrok?
The process typically involves the following steps:
• Initial Consultation: Understanding the client's objectives and site conditions.
• Survey Planning: Designing the survey parameters and logistics.
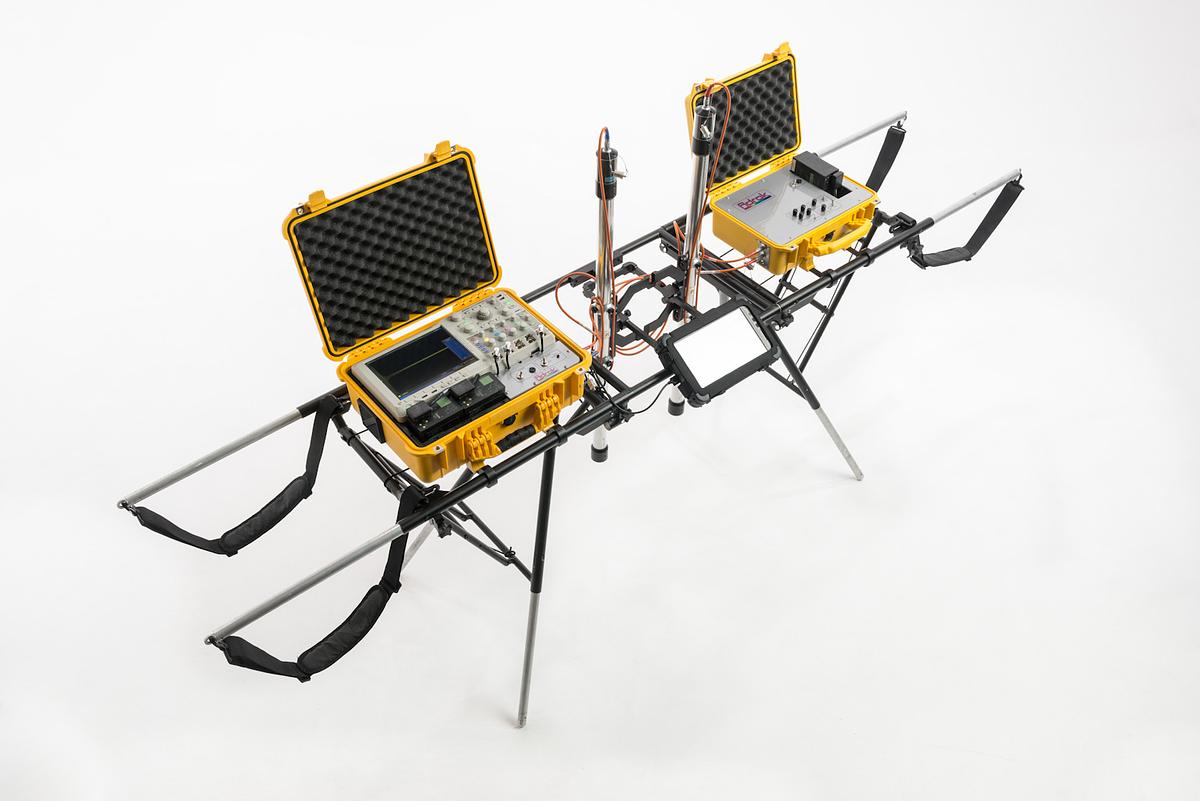
• Field Survey: Deploying ADR equipment and collecting data.
• Data Analysis: Processing and interpreting the collected data.
• Reporting: Delivering detailed reports and visualizations to the client.
• Follow-Up: Providing support for data interpretation and further exploration planning.
Q15. How can potential clients get started with an ADR survey?
Discover how Adrok’s cutting-edge ADR technology can support your projects. Contact us today via our website www.adrokgroup.com or email revolution@adrokgroup.com to discuss services, partnerships, or any inquiries. Our team is ready to provide expert guidance and innovative solutions for your subsurface exploration needs.
For more information on how to unlock the subsurface with Adrok — or ask a question that is not listed above or to schedule a consultation, please get in touch.
🔬 Pushing the boundaries of subsurface imaging with ADR
At Adrok, our patented Atomic Dielectric Resonance (ADR) technology offers a unique, non-invasive geophysical method for high-resolution subsurface imaging and material characterization.
ADR transmits and records microwave and radiowave energy to measure: 📡 Dielectric permittivity 📡 Conductivity 📡 Spectral signatures
This allows us to: ✔️ Differentiate lithologies and fluids ✔️ Detect stratigraphic boundaries and anomalies ✔️ Generate depth-calibrated virtual boreholes ✔️ Reduce dependence on costly invasive drilling
By integrating ADR with conventional exploration workflows, geoscientists can de-risk projects, improve target accuracy, and achieve more sustainable exploration outcomes.
⚒️ We’re collaborating with exploration teams worldwide to advance geophysics and deliver actionable insights at a fraction of the environmental and financial cost of traditional methods.
.jpeg)
📚 Download a Glossary of Terms
|
Term |
Definition |
|---|---|
|
ADR |
Atomic Dielectric Resonance |
|
Correlation Method |
Stacks a large number of traces from a series of stare scans and applies mathematical filtering to give a baseline over which the signal can be described as being of high quality. The signal returns are analyzed to show distinct changes in lithology for the area under investigation |
|
Dielectric Constant (DC) |
The index of the rate of transmission of our ADR wave packet through a medium relative to the transmission rate of the beam through vacuum. This is also sometimes called the transmissivity index, or relative permittivity. The vacuum has a dielectric constant of 1. For a medium such as limestone the dielectric constant (er) is typically 9 |
|
E-Log (Energy log) |
During a stationary scan (“Stare” scan) the ADR transmitter and receiver antennas are positioned at known grid co-ordinates and aimed downward. The energy log (“E-log”) indicator is produced by dividing the Stare scan image data in time windows. Windowing is carried out in equal time intervals or the time axis is migrated to depth after our WARR tracking of dielectric and windowing is performed equal spatial intervals. The data windows are subsequently analyzed and/or enhanced utilizing a suite of signal and image processing techniques such as Fourier analysis, wavelet decomposition, and image enhancement algorithms using RADAMATIC, Adrok’s proprietary data analysis software. Amongst other indicators, this analysis produces the E-Logs which represent estimated energy values as a function of depth and were found to be excellent indicators. In this paper they are plotted on a logarithmic scale |
|
P-Scan |
Profile Scan of the subsurface with fixed focus Antenna spacings at ground level. Both Transmitting and Receiving Antennas are moved simultaneously in parallel along the length of the scan line. This produces an image of the subsurface (from ground level) based on the two-way travel time of Adrok ADR Scanner’s beams from Transmitter (Tx) to Receiver (Rx) Antenna. The WARR data converts the P-Scan time-stamps into depths in metres. |
|
Stare |
A stationary scan where data collected with both antennae pointing the ground |
|
WARR |
“Wide Angle Reflection and Refraction” scan to triangulate subsurface depths from the surface ground level. The transmitting antenna is moved at ground level along the scan line, away from the stationary receiving antenna which is positioned at the start of the scan line. Collected by ADR Scanner at ground level (produces depth calculations) |
|
Weighted Mean Frequency |
The frequency and energy values are combined to produce a Weighted Mean Frequency for each measured depth interval. WMF is the energy weighted mean of the frequencies. Therefore, frequency values with a high weight contribute more to the WMF than frequency values with a low weight |
