
International Journal of Remote Sensing, 2013
To cite this article: G.C. Stove, J. McManus, M.J. Robinson, G.D.C. Stove & A. Odell (2013): Ground penetrating abilities of a new coherent radio wave and microwave imaging spectrometer, International Journal of Remote Sensing, 34:1, 303-324 To link to this article: http://dx.doi.org/10.1080/01431161.2012.713529
Full terms and conditions of use: http://www.tandfonline.com/page/terms-and- conditions
This article may be used for research, teaching, and private study purposes. Any substantial or systematic reproduction, redistribution, reselling, loan, sub-licensing, systematic supply, or distribution in any form to anyone is expressly forbidden.
The publisher does not give any warranty express or implied or make any representation that the contents will be complete or accurate or up to date. The accuracy of any instructions, formulae, and drug doses should be independently verified with primary sources. The publisher shall not be liable for any loss, actions, claims, proceedings, demand, or costs or damages whatsoever or howsoever caused arising directly or indirectly in connection with or arising out of the use of this material.
Ground penetrating abilities of a new coherent radio wave and microwave imaging spectrometer
G.C. Stovea, J. McManusb , M.J. Robinsona , G.D.C. Stovea , and A. Odella
aAdrok Ltd., Edinburgh, UK; bDepartment of Earth Sciences, University of St Andrews, St Andrews, UK (Received 18 January 2012; accepted 2 July 2012)
The early use of synthetic aperture radar (SAR) and lidar systems from aircraft and space shuttles revealed the ability of the signals to penetrate the ground surface. Atomic dielectric resonance (ADR) technology was developed as an improvement over SAR and ground penetrating radar (GPR) to achieve deeper penetration of the Earth’s subsurface through the creation and use of a novel type of coherent beam. When pulsed electromagnetic radio waves pass through a material, they generate measurable responses in terms of energy, frequency, and phase relationships. A deployment of the ADR equipment in a field study of a measured section of Dinantian sediments in a disused quarry at Cults, Fife, Scotland, has confirmed the ability of the method to distinguish the lithologic type and their respective thickness ranging from limestones through sandstones, siltstones, seatearths, and coals. Borehole data were used to corroborate the ADR imaging spectrometer. The signal penetrated more deeply into the ground than the 20 m height of the exposed rock section, and it showed good correlation with records from two nearby boreholes that extend to lower levels. Reliable lithological recognition at ground penetration of more than 90 m had been achieved. ADR was also deployed over deeper borehole sites in the Limestone Coal Formation at Higham and Lathones, Fife, Scotland. Here the signal was shown to penetrate the subsurface to depths of 225 and 580 m, respectively. A subsequent field deployment of ADR at Cousland, Midlothian, Scotland, demonstrated subsurface penetration in the Lower Limestone Formation by ADR to 700 m – as confirmed from nearby boreholes.
Introduction
The development of atomic dielectric resonance (ADR) by Dr Colin Stove was inspired by his experiences of working with synthetic aperture radar (SAR) sensors, from both satellites (ERS1 and RADARSAT) and from the Space Shuttle SIR-B (Shuttle Imaging Radar-B) experiment in the early 1980s, as well as his work with conventional ground penetrating radar (GPR) systems. ADR was developed as an improvement over SAR and GPR to achieve deeper penetration of the Earth’s subsurface through the creation and use of a novel type of coherent beam. ADR is used as a geophysical technique to provide a precision instrument for the accurate geological recognition of rock layers and identification of rock types by transmission through the rock medium as well as reflection from each subsurface rock layer.
The aim of this article is to report on tests of the subsurface Earth penetration capabilities of a new spectrometer as well as its ability to recognize many sedimentary, igneous, and metamorphic rock types in real-world conditions.
Although GPRs are now popular as non-destructive testing tools, their analytical capabilities are rather restricted and imaging is often crude. The relatively high transmitter power used in conventional GPRs gives only very shallow penetration in many soils and rocks. Conventional SAR systems, which also use electromagnetic waves at high power to investigate the internal structure of non-conducting substances within the ground, likewise provide relatively low resolution and ground penetration. The ADR methodology does not involve such high-power transmission and achieves much deeper penetration than conventional GPRs (Stove 2005).
In contrast to conventional GPRs, which transmit omnidirectional electromagnetic signals, ADR technology uses directional electromagnetic radiation as resonating transmitting and receiving beams of energy. Although, some GPRs may have shielded antennae, they still leak radio waves above ground in the opposite direction to the main pathway of transmission into the ground.
An ADR beam transmitted through the ground is a pulsed, confocal beam (like a long, narrow inverted cone in shape) of coherent (in-phase) radio waves and microwaves, producing minimal dispersion through its confocal and resonant mased nature. The transmitted ADR beams have two components: a long wavefront standing wave to achieve deep penetration and shorter resonance waves within the standing wave to enhance vertical resolution. The transmitted ADR beams typically operate within the frequency range of 1–100 MHz (Stove 2005).
When SARs were first deployed from aircraft towards the end of the last century (Stove 1981; Climino and Elachi 1982), it was anticipated that some, albeit limited, penetration of the ground surface might be achieved using X-band (30 mm) and C-band (55 mm) wavelengths. On 6 June 1981, a Canadian Convair 580 aircraft acquired X-band and C-band dual-polarization SAR imagery of a European Space Agency Test Coastal Transect (GB1), which included beach and sand dunes at the Sands of Forvie peninsula at the mouth of the Ythan Estuary in Scotland (Stove 1981, 1983). It was anticipated that ground penetrations of 1.5 and 3 cm, respectively (equivalent to half-wavelengths), would be obtained over wet beach areas and dry dunes. However, the signals returned from the fixed look-angle sensor identified a distinct interface some 3 m below the surface. Boreholes identified this interface as the top of the groundwater, confirming that the signals had penetrated to this depth from the surface over a lateral distance of more than 100 m across the dune slack area. In 1981, this greatly enhanced depth of penetration was again recognized from NASA Space Shuttle (SIR-A) imagery, which detected ancient river channel systems beneath 3 m of sands, as reported by McCauley et al. (1982) from south-western Egypt. Laboratory studies by Elachi, Roth, and Schaber (1984) showed that for the SIR-A sensor at L-band frequency, field confirmation of the airborne and spaceborne data by Elachi and Schaber in Elachi et al. (1984) showed sand thicknesses between 0.8 and 2 m in the Mojave Desert.
During 1984, the SIR-B (SAR) sensor was operated onboard the Space Shuttle over an 8 day test programme. For the duration of this open test programme, Dr Colin Stove was commissioned by the UK Ministry of Defence to under fly the Space Shuttle and acquire in real-time, simultaneous thermal infrared imagery over a shallow water test area in the North Sea. In this experiment, the SIR-B used a variable look-angle sensor ranging between 15◦ and 55◦. The ground penetrating capability of the narrower look-angle equipment was greater than that of the larger look-angle apparatus. This has stimulated the development of narrow, coherent lased transmission beams for use in a new type of ground surface-based imaging apparatus.
n recent years, the technology for the production of laser light has become widely available, and applications of this medium to the examination of materials are constantly expanding. Although the earlier applications concentrated on the use of visible laser light, the development of systems using invisible laser light are now being further explored. Maser beams are well known. They are coherent beams of electromagnetic waves at microwave and radio wave frequencies. They are a longer wavelength equivalent of lasers. In this article, we report on a series of experiments in which rocks of different compositions and textures have been exposed to pulsed beams of wide-band, maser light conditioned dielectric resonance, to produce a range of differing atomic dielectric energy and frequency responses detectable by suitable receivers. Conditioning the beam by dielectric optics creates a synthetic lens effect so that the sensors appear to have much longer chambers with wider apertures than their actual physical size. This effect produces narrow coherent beams of pulsed and mased radio waves and microwaves, which are good for illuminating target interfaces and materials. Signals transmitted by ADR are within the high-frequency radar to millimetre radar frequency range and have wavelengths of less than 100 m.
Methodology
Description of the ADR system
ADR is a patented investigative technique (Stove 2005) that involves the measurement and interpretation of resonant energy responses of natural or synthetic materials to the interaction of pulsed electromagnetic radio waves, microwaves, millimetric, or sub-millimetric radio waves from materials which permit the applied energy to pass through the material. The resonant energy response can be measured in terms of energy, frequency, and phase relationships. The precision with which the process can be measured helps define the unique interactive atomic or molecular response behaviour of any specific material, according to the energy bandwidth used. ADR is measurable on a very wide range of hierarchical scales both in time and space. Time scales may range from seconds to femtoseconds, and spatial scales from metres to nanometres.
Some aspects of the field and laboratory ADR equipment involve certain conditions being satisfied during the set-up of the apparatus so as to obtain standing wave oscillations in ADR test sample chambers and/or in ADR remote-sensing antenna system assemblies. In this respect, it is important to selectively control the group velocity (typically at the speed of light, 299,792,458 m s–1) of the radio wave and microwave radiation as it is emitted or launched by the transmitting antennas into the ground. In particular, for deep scanning it is important for the launch speed of the wave to be sufficiently slow to ensure that the wave can be accurately registered at a precise zero time location by the receiver antennas, after the pulse has been transmitted. The zero time position t(z) in remote sensing or t(0) in geophysics is the start position for ADR range measurements and must be identified on the received ADR signal to determine the true time range (in two-way travel time, usually TWT (ns)) represented by the received signal, returning from each resonant subsurface reflection layer.
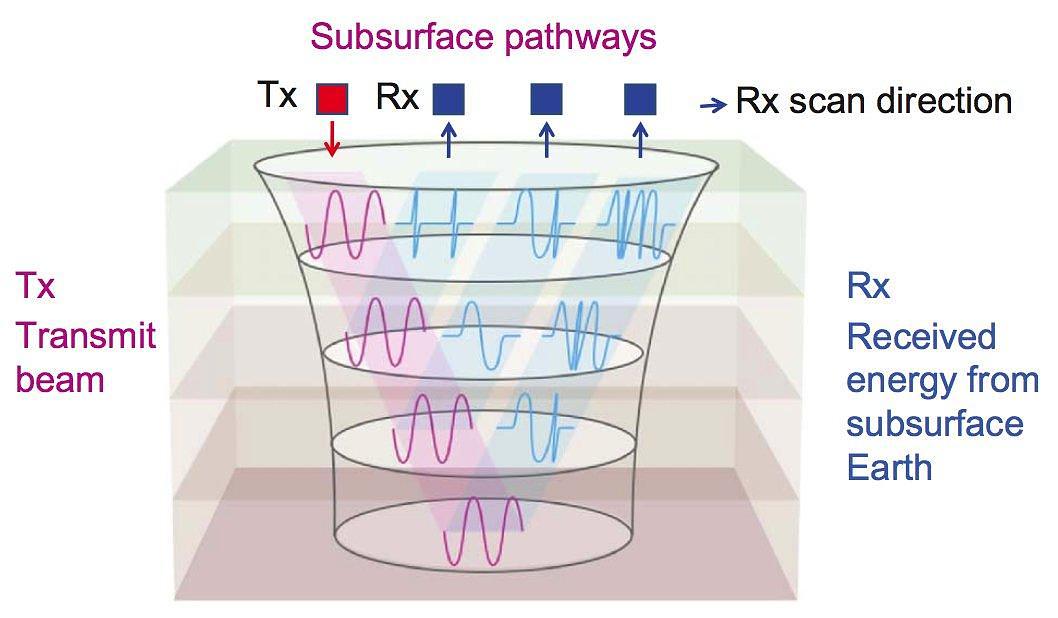
With reference to Figure 1, the wide-angle reflection and refraction (WARR) tracking method is used to (1) identify the upper and lower boundaries of each stratum, (2) determine the inter-layer beam velocity and mean dielectric constant (ε) of the material in each stratum, and (3) identify the materials in the various strata from both the εs, known as molecular or atomic spectral lines (after fast Fourier transform (FFT) analysis of the received signals) and spectral ADR statistical parameters data based on known rock types.
ADR accurately measures the dielectric permittivity of materials encountered and determines the ε of each layer of rock to an accuracy of at least 1:400.With deeper penetration and a narrower ADR beam, the accuracy of dielectric mapping improves, and at 1 km depth, an accuracy of 1:4000 can be achieved for the mean dielectrics of narrow layers at this depth. The ε is basically the effect that a given material has on slowing down the ADR transmission signal. Determining the ε of each layer enables each rock layer to be mapped with a depth computation from ground level and can also determine physical properties of the rock layer, such as moisture content, porosity, and density indices. In general, dielectric values for hydrocarbon layers in the Earth tend to be between 2 and 5 for the author’s ADR scanner, if water is absent. In geological terms, the main effect on the signal’s velocity as it propagates through the material is the water content. For example, air has a ε of 1, while water has a ε of ∼80. Most geological materials lie within these boundaries.
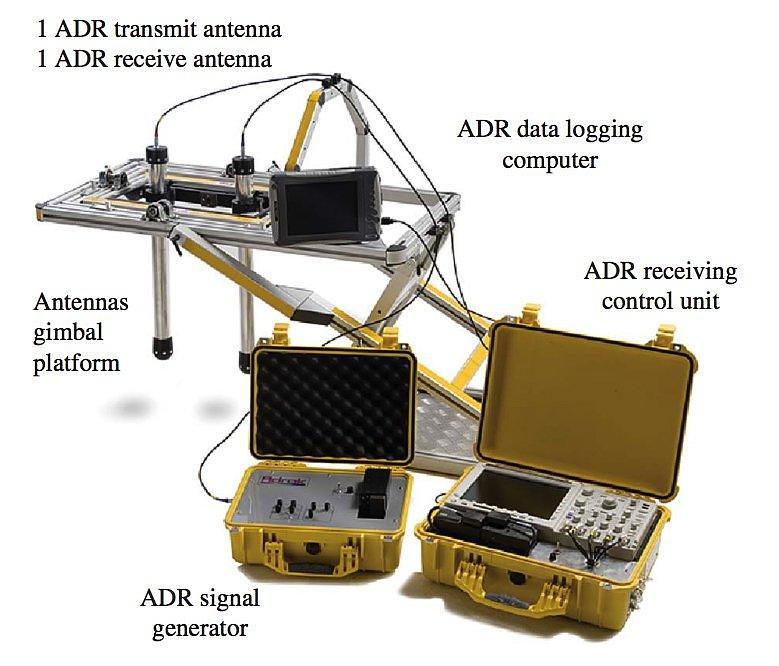
Figure 2 shows the typical shape of an ADR transmit pulse into the Earth and the received energy from the Earth. Figure 3 displays photographs of the ADR equipment.
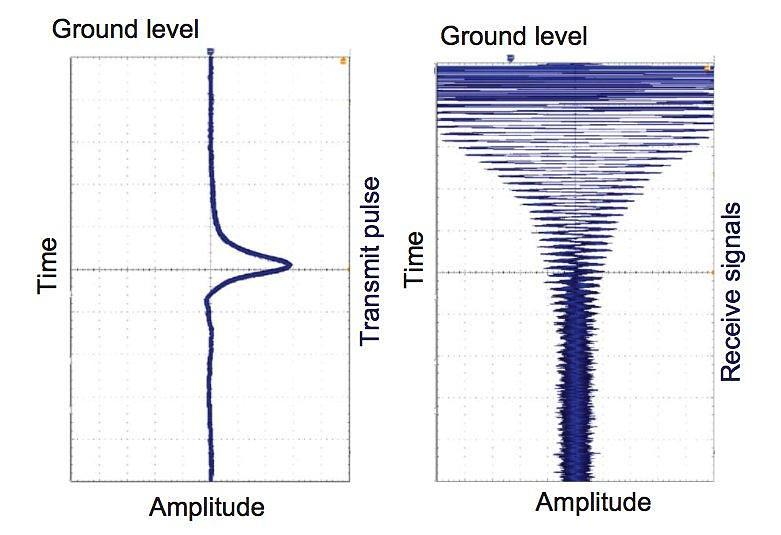
The ADR spectrometer works by sending a narrow beam of energy into the ground using microwaves and radio waves. As it travels downward, the energy character of the beam is altered by the various rock layers it encounters. The beam, which can penetrate to depths up to several kilometres, is continually reflected back by these same rock layers and is recorded on surface.
The recorded data describe how rocks and minerals, including hydrocarbons, interact with the beam as it passes through them and pinpoints their composition. The technology measures the dielectric permittivity of the subsurface as well as characterizing the nature of the rock types based on analysis of both the spectroscopic and resonant energy responses. With traditional GPR technology, the depth of signal penetration is inhibited by the ground conditions (owing to the high power levels of the transmit signal). This is especially the case for ground that is saturated in water – where known radar-based interrogation of the subsurface suffers from signal attenuation attributable to skin depth effects, and thus are limited to very shallow depths of penetration through the Earth.
ADR, on the other hand, has been specifically designed to alleviate this problem. The ADR transmission, unlike GPR, is not a wide-band, omni-directional dispersive beam. ADR generates a low-power transmission beam that is directional. ADR also transmits a resonance beam that helps the transmit signals penetrate through the ground to greater depths than conventional GPR systems (Stove 1981, 1983, 2005).
Producing the ADR beam for remote sensing
ADR transmitting antennas are optically designed using dielectric lenses and can be referred to as behaving like radio wave and microwave telescopes (Stove 2005). In the ADR transmitting telescopes, the dielectric lens sequences amplify the pulsed waves, but the optical feedback provided by lasing in the telescope chamber converts the system into an oscillator and then into a coherent, invisible light generator. (By invisible light, we mean frequencies within the radio wave and microwave spectrum.)
The conditioned ADR beam of photons (coming out of the transmitting antenna) enters the ground and penetrates through soil and rock. As the beam encounters the component materials, it stimulates the electrons of the atoms to release energy according to their com- positions. The conditioned pulse of photons passes through the structure of the atom and emerges to encounter more atoms further along its path. Electrons from each individual atom release energy in all directions, and by timing the first arrival of this burst of low energy from a time-zero position beside the transmitting source to different ∆x separation distances between the transmitting sensor’s (Tx) cylindrical chamber and the receiving sen- sor’s (Rx) cylindrical chamber, the isometric move-outs or dispersion of the beam can be computed in the y-direction at right angles to the scanning x-direction path for increasing separations of Tx and Rx (Stove 2005).
ADR receiving system
The ADR transmitters must be oriented in the same direction as the receiving antennas. Mounted on a tripod, the receiving antenna (Rx) is kept vertical pointing into the ground at 90◦ look angle and the transmitting antenna (Tx) is thus moved away from Rx along the x-direction looking at 90◦ into the ground. The increasing beam dispersion through ray path move-outs can be computed and the increasing cylindrical beam widths are computed and plotted as the X-separation distance increases. By simple triangulation, the changing beam velocities through rock layers of differing εs can be computed by normal move-out (NMO) mathematics and ray tracing theory (after Snell’s law). Only when these two independent depthing methods give the same depth measurement, does the ADR software accept that depth reading (this is what the authors call depth parallax). Since the transmitting beam set-up is lased in the cylindrical chamber of the transmitting telescope and the speed of the lased beam is slowed down by special dielectric optics in the chamber, the resulting beam dispersion going down through the ground becomes slightly narrower with depth. This arrangement is called confocal focusing (akin to that of a confocal microscope, but in this case used at the macro-scale rather than the micro-scale with a microscope) at rock layers and is ideal for mapping geological layers of varying εs, in each case plotting the exact rock volume illuminated between layer-bounded beam limits. Different pulse set-ups at the surface are possible. Scanning a WARR line is carried out by moving the Tx sensor away from Rx at a uniform speed (commonly, 0.5 m s–1), over scan lengths of 50 or 100 m, for example. Moving from a Tx to Rx separation of 50 m increases the beam width and Y-dispersion from 0.5 to 25 m. The important point is that the centre of the confocal beam is always looking straight into the ground at 90◦ (if the antennas are parallel and pointed accurately using a scanning gimballed platform) and the light path direction obeys Fermat’s principle of least time. This makes an ideal reference beam for checking the progress of drilling rods that do not always go straight into the ground through rocks of contrasting densities (Stove 2005).
The nature of the return signal, its frequency, energy levels, and phase changes (if any) are determined by the minerals encountered. In a rock mass, the component minerals may vary, but in general, sandy rocks are comprised principally of quartz (SiO2), limestones mainly of calcite (CaCO3), coals largely of carbon (C), and clays or shales mainly of assemblages of iron- or magnesium-alumino-silicates. Cascading harmonic analysis of the emerging electromagnetic radiation enables the energies and frequencies of the signals released by the materials to differ sufficiently for the rock compositions to be recognized by computer processing. Repeated characterization of the ADR signals received from known rocks at known depths in quarries or boreholes has made it possible to classify the principal rock types of Central Scotland and identify them with confidence in blind tests beside logged boreholes.
Processing and interpretation of the received ADR signals
The analysis of the returned ADR signals from the subsurface to the ADR receiving system is performed by FFT analysis of the received spectrum (which includes radio waves and microwaves). This results in mathematical and statistical analyses of the received spectrum and the recognition of energy, frequency, and phase relationships.
More detailed spectrometric analysis is achieved through the quantum electrodynamic (QED) approach (Feynman 1985) by quantizing the entire ADR receive spectrum. In ADR quantum theory, this is similar to the equal temperament system of tuning musical instrments – in which each pair of adjacent musical notes has an identical frequency ratio. In this tuning methodology, an interval (usually an octave) is divided into a series of equal steps, with equal frequency ratios between successive notes. For example, a violin is tuned in perfect fifths. The notes are G–D–A–E, where the fundamental G is 192 Hz, D is 288 Hz, A is 432 Hz, and E is 648 Hz. Note that a perfect fifth is in a 3:2 relationship with its base tone. The octave frequency interval is covered in seven steps (A, B, C, D, E, F, and G) and each tone is the ratio of the seventh root of 3/2, or in mathematical form ((3/2)1/7). For ADR, the quantized frequency spectrum includes 3 octaves of the radio wave spectrum and 33 octaves of the microwave spectrum. When ADR is applied to geological analysis, rocks can be genetically classified by notes and octaves using the above spectrometric approach – adding a new quantum dimension to recording rock music.
Study area
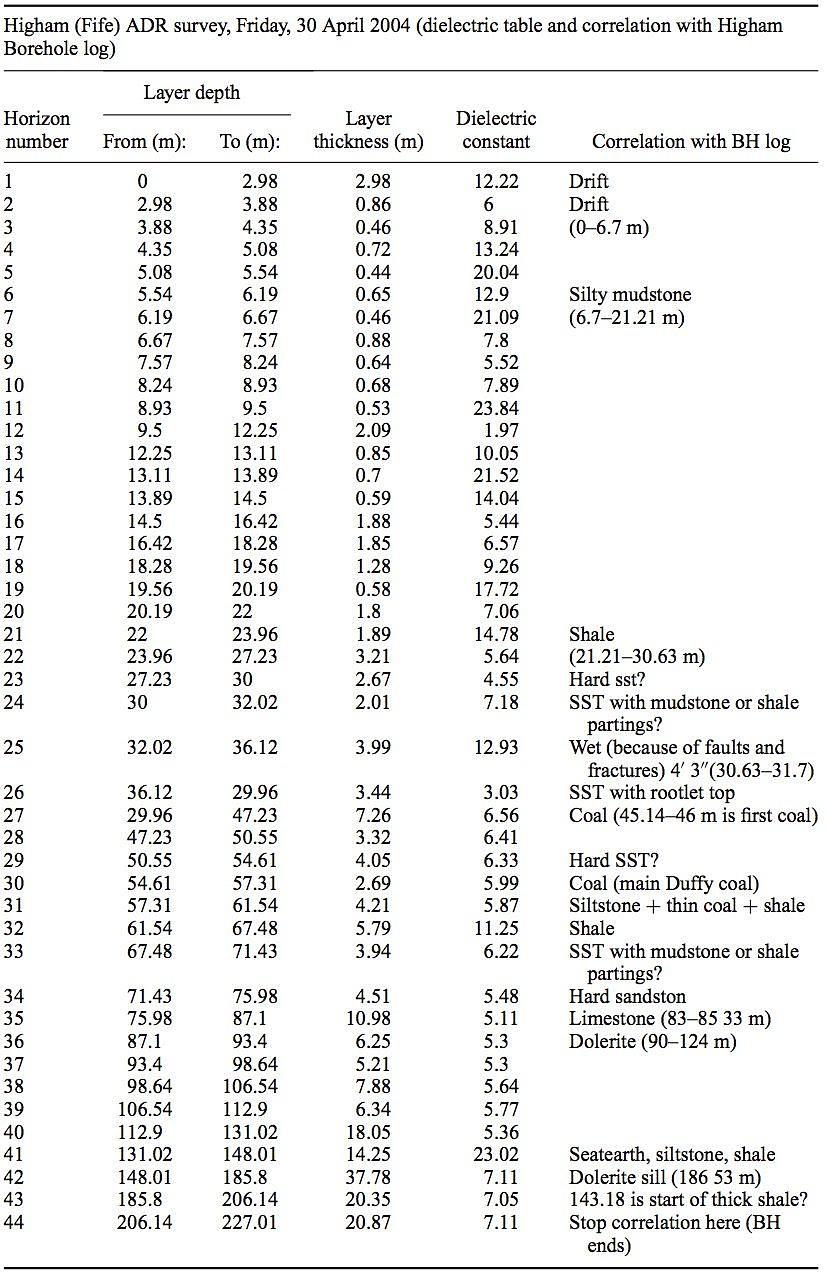
After several years of preliminary work, the ADR equipment has undergone sufficient development to allow extended testing of materials in the field. Initial tests have been carried out using wide-band, conditioned pulses between 1 and 100 MHz at a series of sites in Central Scotland. In this article, we report on a series of findings from a quarry in the late Brigantian Lower Limestone Formation (Brown et al. 1996; Read et al. 2002) at Cults, Fife (NO353089). In addition to detailed findings at Cults, we have carried out studies in the Limestone Coal Formation in Fife. This has included profiling along the A915 road in the East Fife Coalfield (NO465093, see Table 1 (for Lathones) and Table 2 (for Higham) imaged beside the Lathones Borehole). More recently, the equipment has been successfully deployed at other sites in the UK such as the Cousland natural gas site, east of Edinburgh, Scotland (Tables 3 and 4; Figures 4 and 5), and overseas. The ADR survey at Cousland was carried out within the mapped area of the gas field, which had been abandoned in the 1960s (UTM 67.85◦ N; 37.88◦ E); (55◦ 54′03.5′′ N, 002◦ 59′41.0′′).
The main rock types tested in this study were limestone, sandstone, coal, dolomite, basalt, shale, and mudstone, but elsewhere we have characterized many other rock and mineral types including igneous materials and a range of metamorphic lithologies from Scotland and overseas.
Results
Cults quarry, Fife
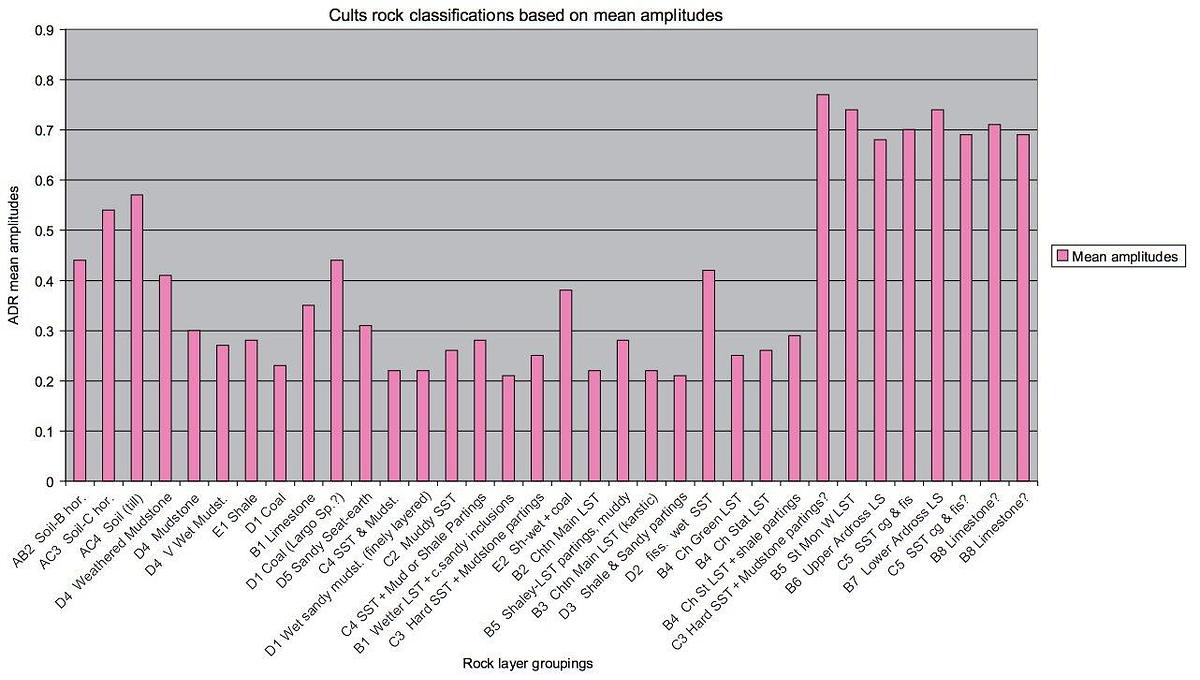
At Cults, the system was deployed shooting vertically downwards into the ground along a 20 m traverse line, 7.6 m behind the crest of a 19 m high quarry face, from which a detailed log of the exposed succession of the horizontal sedimentary rocks had been measured. Signal responses were collected at 0.02 m intervals along a traverse line from east to west and then reversed, from west to east. Regular electronic fixes were recorded at 1 m intervals to allow the scan lines to be horizontally rectified if there was any variability in the scanning speed. Both traverses were repeated, with consistent results being obtained. For triangulation, WARR scans were then carried out in both directions along this traverse. In this mode of data collection, the receiver is placed at chainage 0 m at the start of the east to west line and the transmitting sensor is moved from east to west for the full 20 m length of the traverse. This enabled a reflection and refraction profile to be obtained over the first half of the traverse length (i.e. from 0 to 10 m in chainage). The reverse scan, with the receiver positioned at chainage 20 m and the transmitting antenna moving from chainage 20 to chainage 0 m, enabled a reflection and refraction profile to be obtained over the second half of the traverse from 20 to 10 m in chainage. Triangulation of each interface was enabled by ray tracing and NMO computations, similar to the methods used in the seismic industry. This allowed WARR tables listing depths, layer thicknesses, and inter-layer εs for each distinct rock layer (with differing transmission velocities) to be produced. The processed ADR signal after WARR analysis and the measured section are shown in Table 5, where alphanumeric codes have been allocated to the rocks according to their known and interpreted compositions. The signals showed consistent similarities between the limestones, between the mudrocks, between the coals, and between the sandstones, irrespective of their known depths determined from the exposed quarry face.
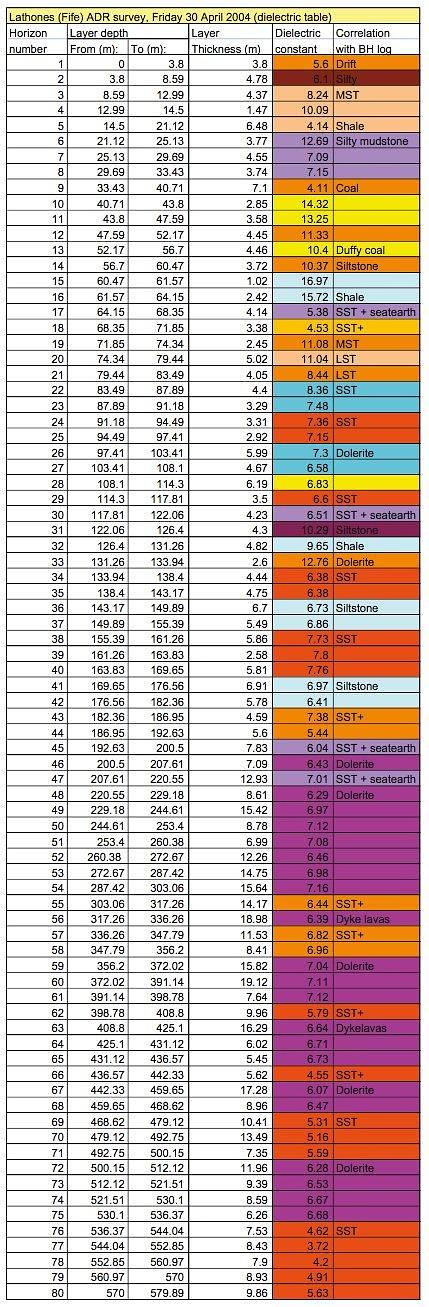
Table 1. Dielectric table produced from the WARR scan at Lathones, Fife, beside the borehole.
The quarry, which is a Regional Important Geological/Geomorphological Sites (RIGS)protected site, had been disused for several years prior to the study. The detail of the exposed Visean succession, as originally outlined by Geikie (1900), reveals two almost complete cycles of deposition. At the base of the face is the massive Charlestown Main (Blackhall) Limestone, comprising several thin beds of limestone, several of which are separated by ancient karstic surfaces. Some 5.7 m above this are two thin coal seams with their underlying seatearths. Between them lies a thin limestone horizon, as noted by Geikie (1900). The two coal seams may be the equivalents of the Largoward Black Coal, which, in the Drumcarrow Borehole, is 11 km to the east. Forsyth and Chisholm (1977) showed that these two coal seams consisted of two closely spaced units at about the level of the Seafield Marine Band, 15 m below the Lower Kinniny Limestone. Separating most of these units are mudrocks and muddy sandstones (horizons 9–11, 16, 17, 19, and 22 in Table 5). Several water-saturated horizons are present (horizons 7, 17, 24, and 26 in Table 5). The coals and the Charlestown Main Limestone have been worked in the neighbourhood.
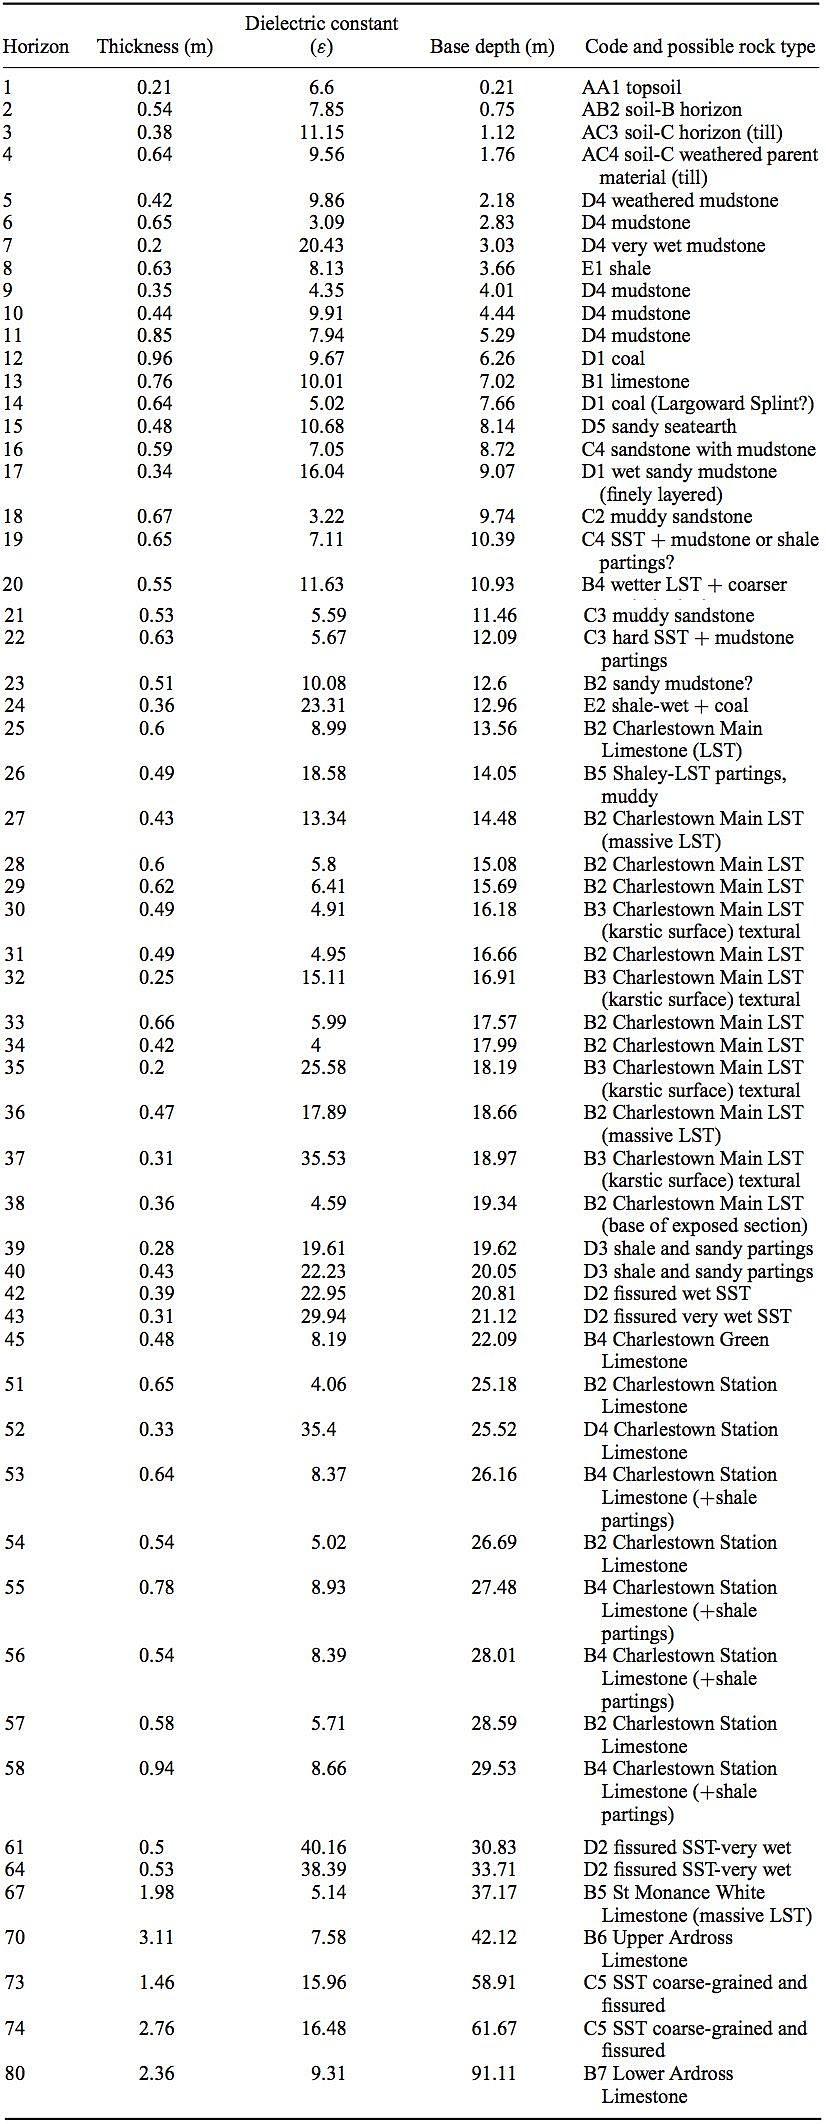
From the upper part of the record, for which there is confident identification of the rock types, it is evident that the ε increases with the water content of the rocks. The dry mudrocks show εs of 3.09–9.91, averaging 6.26, whereas their wet counterparts ranged from 9.86 to 23.31, averaging 17.41. In the Charlestown Main Limestone, the εs for the mass of the rock ranged between 4.00 and 17.89, averaging 7.65, whereas in the texturally altered limestones with karstic features they varied from 13.34 to 35.53, averaging 22.31.
The ADR signal actually penetrated much deeper than the exposed quarry face, where the identities of the sediments concerned were well defined. Several further cyclic sequences of flat-lying sediments appear to be present beneath the floor of the quarry. The records of boreholes put down by the British Geological Survey in 1994 (Cults No. 1 and Cults Farm) some 300 and 400 m to the northwest of the quarry, respectively, confirm the presence of further cyclic sequences at approximately the heights detected from the quarry face above. Four limestone horizons, believed to be the Charlestown Green (horizon 45 in Table 5), Charlestown Station (horizons 51 to 58 in Table 5), St Monance White (or Blackbyre, horizon 67 in Table 5), and Upper Ardross Limestones (horizon 70 in Table 5), have been identified, the latter three levels coinciding with those recorded in the borehole logs. One further suggested bed of limestone, possibly the Lower Ardross Limestone (horizon 80 in Table 5), appears to be present below the Upper Ardross Limestone, but in the absence of exposures or more deep boreholes, this identity cannot be confirmed.
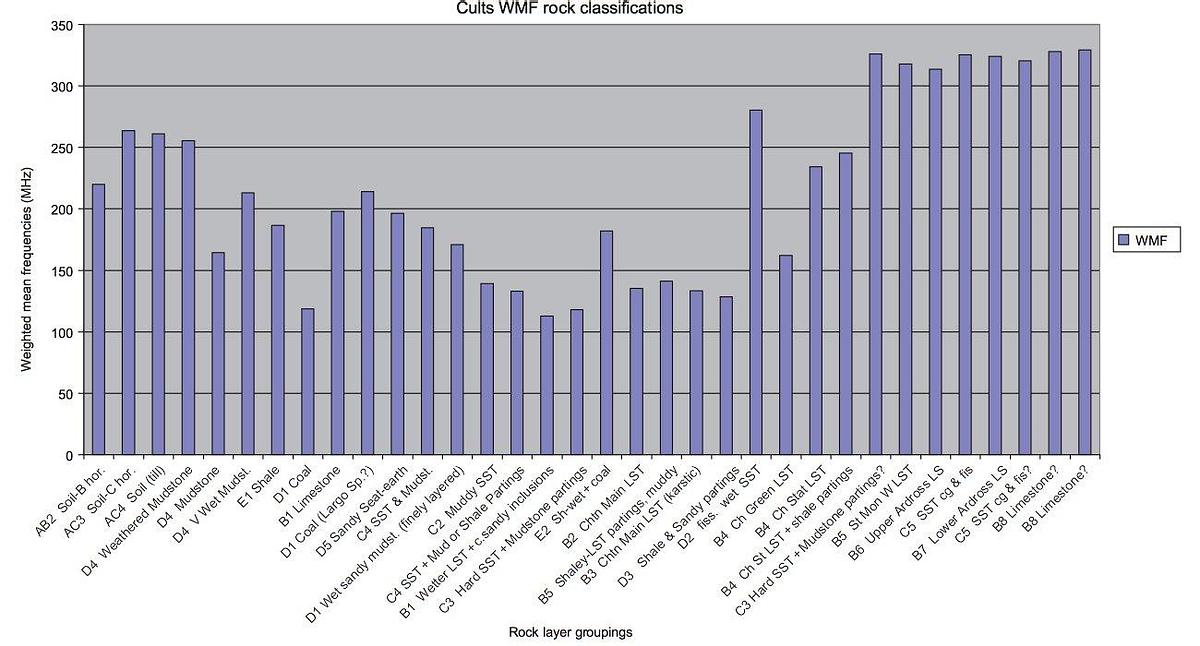
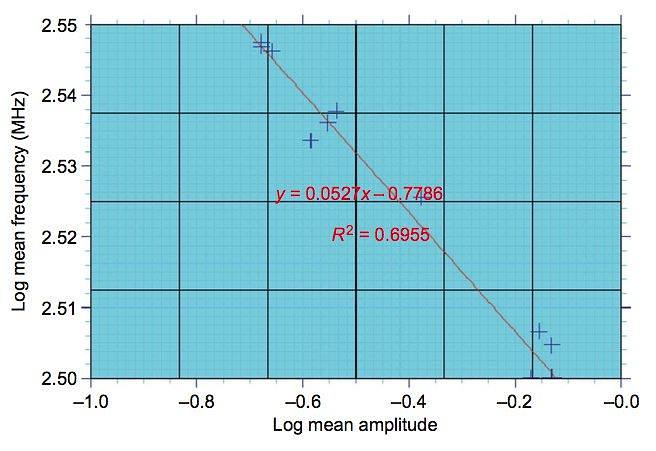
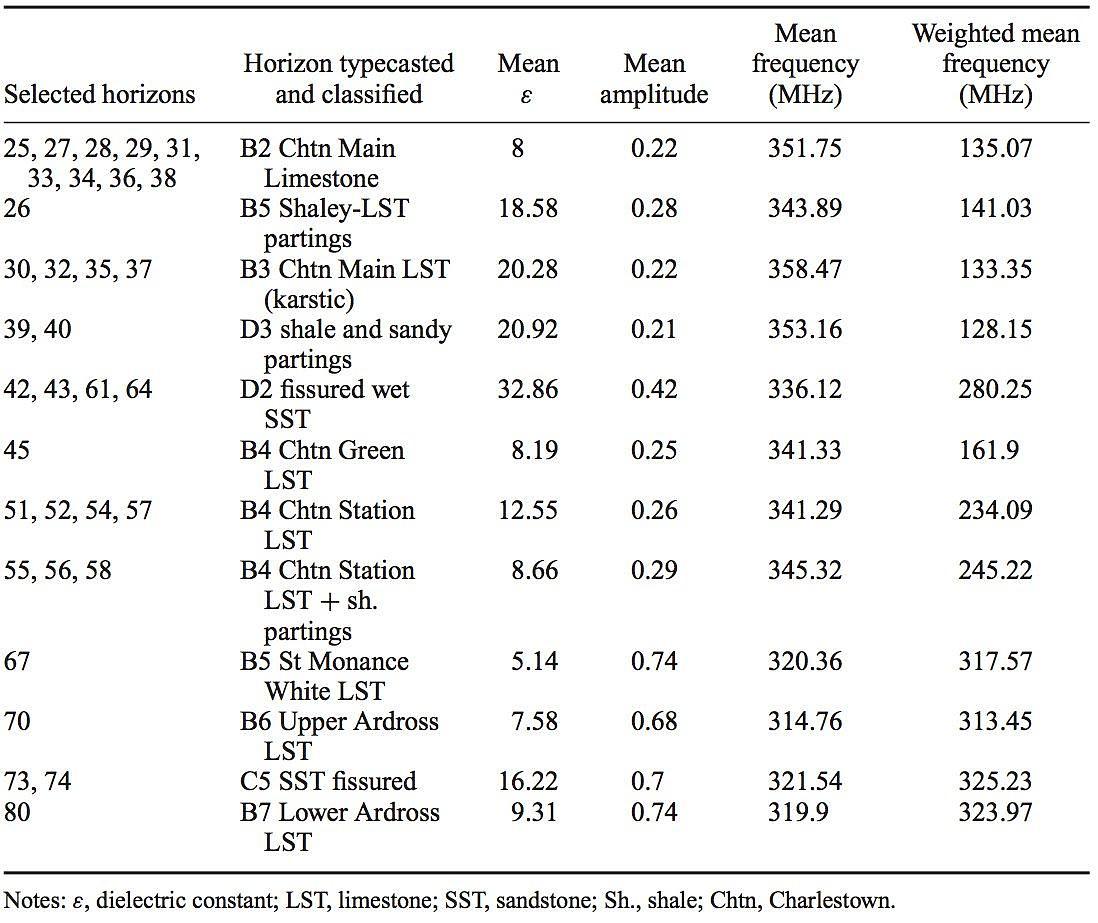
If selected horizons from Table 5 are sub-sampled and average parameters calculated and listed as in Table 6, then some significant correlations can be evaluated. These exist between mean amplitudes and mean frequencies and mean amplitudes and weighted mean frequencies (Figures 6 and 7). For example, the correlation between mean amplitude and mean frequency for the 12 consecutive horizons averaged from the Table 5 layers is −0.9510 (Figure 8), which is an inverse correlation and is significant at the 0.001% level or 99.9% confidence level for (n – 2) = 8 degrees of freedom. This value greatly exceeds the tabulated value of 0.8721 (Table VII, Fisher and Yates (1963)) and can be statistically described as highly significant. Figure 8 is actually a plot of the log-linear correlation between mean frequency and mean amplitude, where R = –0.8339 from the linear fitted trend. The correlation between mean amplitude and weighted mean frequency is +0.8937, which is a positive correlation and is again significant at the 99.9% confidence level for 8 degrees of freedom. Finally, if the correlation between frequency and weighted mean frequency is evaluated, it is seen to be another inverse relationship of −0.9091, which is again significant at the 99.9% confidence level. This result suggested that these ADR parametric relationships could be a significant way of identifying the rocks sampled in Table 6.
The Cults Quarry survey was to a relatively shallow subsurface depth. Further surveys nearby at Lathones and Higham confirmed the spectral relationships first established for the rocks at Cults Quarry in Fife at deeper subsurface depths.
Cousland, near Edinburgh
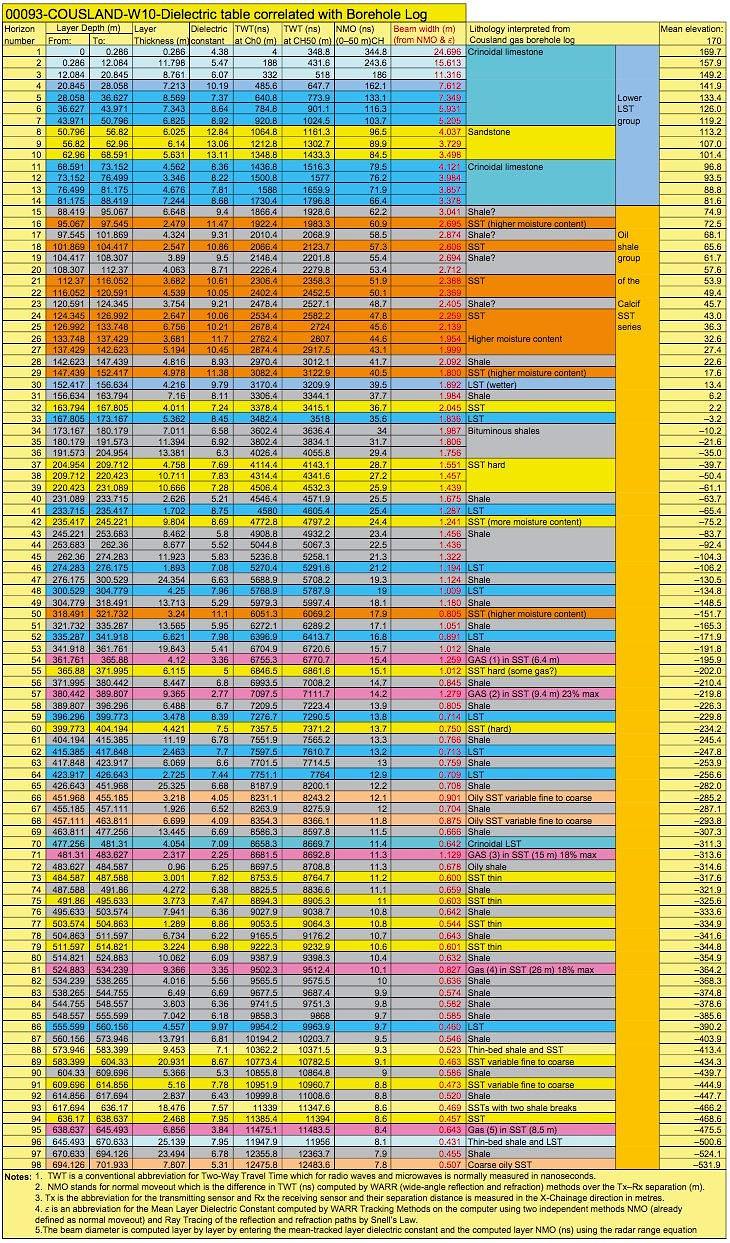
More recently, the equipment has been successfully deployed at other sites in the UK such as Cousland natural gas site, east of Edinburgh, Scotland (Tables 3 and 4; Figures 4 and 5), and overseas. The ADR survey at Cousland was carried out within the mapped area of the gas field, which had been abandoned in the 1960s (UTM 67.85◦ N; 37.88◦ E); (55◦ 54′03.5′′ N, 002◦ 59′41.0′′). A summary log, originally provided by British Petroleum (BP), includ- ing a field report revealed the stratigraphic characteristics of five gas-bearing sandstones and several oil-bearing sandstones. The survey took place along a north–south traverse on the road leading south from Cousland village over the gas field anticline and about 50–100 m from the position of the Cousland-1 gas well. The Cousland gas field occupies an anticlinal structure on the eastern margins of the Midlothian Coalfield (Scotland). At surface is the Visean-aged Blackhall Limestone of the Lower Limestone Formation (see crinoidal limestone in surface layers of Table 3). The LLGS is underlain by what is now called the Aberlady Formation in which the gas-bearing sandstones were found.
The ADR results listed in Table 3 reveal that from the surface at a mean elevation of 170 m above mean sea level down to about 81 m, the Lower Limestone Group consists of two thick limestone blocks (ADR layers H1–H7 and H11– H14; H stands for horizon (i.e. rock layer in the ground)) separated by an 18 m-thick sandstone block (ADR layers H8–H10). The εs for the limestones in the first 28 m were between 4.38 and 6.07. These values are low for limestones, and geologists believe that this can be attributed to weathering over millennia that has caused dissolution cracks, fractures, and cavities in the limestone down which surface water has drained leaving spaces filled with air and thus reducing the εs through air resonance of the signals. Table 3 shows that below this depth, the crinoidal limestone had mean dielectric layer values in the range 7.81–8.92, fairly typical for limestones. In contrast, the three sandstone layers from 56 to 68 m in depth had high mean ε values, between 12 and 13. These high values are attributed to the sandstone being saturated with groundwater and the beam diameter narrows slightly to 4.04, 3.73, and 3.50 m going through layers H8, H9, and H10. Passing back into the crinoidal limestone at H11 with a lower ε of 8.36, the beam diameter opens up again to 4.12 m in width. At deeper levels between 95 and 152 m in depth, the mean ε values for the sandstone layers decreased to around 10, which was interpreted as being partially wet.
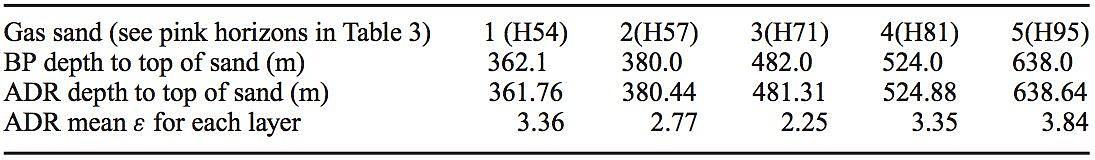
The depths of five gas sands determined by ADR were extremely close to those from the Borehole data and the corresponding εs were very low. The comparative data are listed as follows:
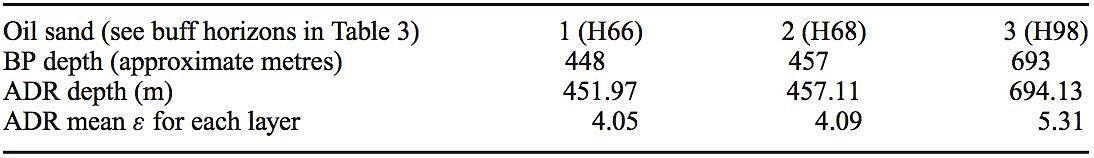
Three oily sands were discovered by Cousland-1 borehole. The likelihood is that these sands had reasonably good oil shows, although insufficient for production compared with the nearby D’Arcy Field (3 km south-west) where some oil production was achieved in the past. The comparative data are given below:
εs for lithologies interpreted as shales in the upper part of Table 3 to depths of about 164 m were high, in the range 8.5–9.5. This corresponded approximately to the section where the εs of the sandstones were also high. This again is interpreted as indicating high water saturation. At deeper levels, the εs of the shales were close to normal at 6–6.8. The shales having εs between 5.2 and 5.95, at 233 and 335 m, coincided with the descriptions of bituminous shales that contained thin, oily sandstones at the Cousland-1 well.
Some important ADR conclusions may be summarized from the Cousland survey. It is important to realize that at Cousland, Adrok had the benefit of some data from the Cousland well. Nevertheless, the results of the ADR WARR depth triangulation survey at Cousland appear impressive. Depths to both the gas sands and the oily sands were very accurate, com- parable to the depths found by drilling. The determination of accurate depths to subsurface rock formations would therefore seem to be a useful application for ADR technology. At Cousland, ADR found the εs of hydrocarbon gas-bearing sandstones to be significantly lower than those without gas, which was in the range of 2.25–3.84. Oil-bearing sandstones also had reduced values for εs (4.05–5.31). Both of these findings may have practical appli- cation in hydrocarbon exploration and production. For example, gas and oil–water contacts may be determined by ADR.
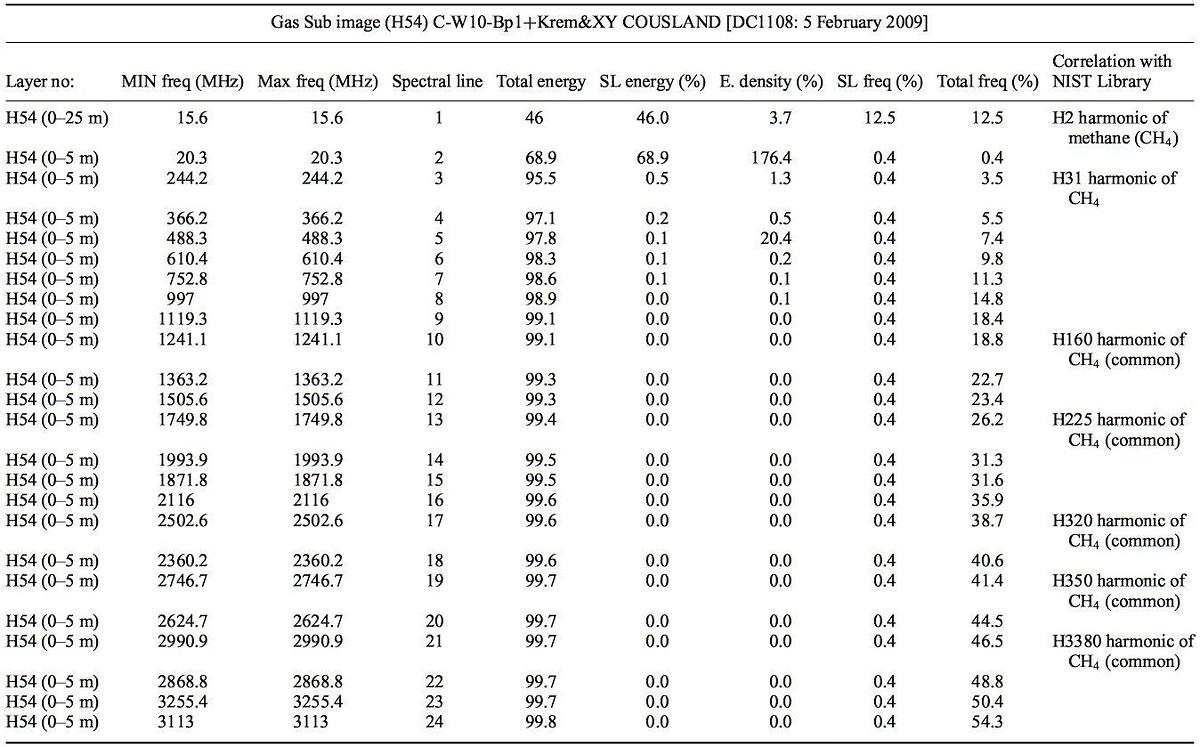
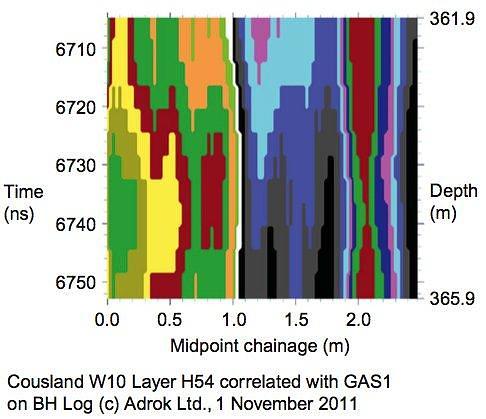
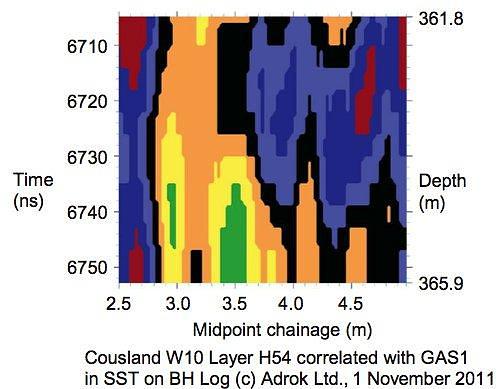
The technology may be potentially useful for mapping the lateral extent of hydrocarbons in a sandstone reservoir. Table 4 is an important testimonial to this prospect. It illustrates the ADR spectral lines detected at horizon H54, which is shown in the Cousland dielectric table (Table 3) as the pink GAS1 (Gas-1, as in methane gas horizon number 1) in sandstone layer from depths of 361 to 365 m. More importantly, the spectral lines highlighted in orange in Table 4 have identified specific harmonics of the ADR known fundamental resonant frequency of methane (CH4 at 7.8 MHz). Table 4 shows that methane appears to be present in the GAS1 layer spectral line analysis shown in Figures 4 and 5, from X-chainage 0–2.5 m (Figure 4) and X-chainage 2.5–5 m (Figure 5), as revealed by the common orange-coloured harmonics listed in Table 4. It is also important to note that the first spectral line of Table 4 shows that the H2 or second harmonic of CH4 (at 15.6 MHz) was detected after a spectral line analysis of the full X-chainage from 0 to 25 m of this GAS-1 depth layer. It would thus appear that spectral line frequencies should be processed and analysed layer-by-layer to reveal gas reservoir characteristics.
Conclusions
This article has reported the subsurface Earth penetration capabilities of a new spectrometer, known as ADR. Furthermore, the article has demonstrated the ability of ADR to recognize certain lithologic types (viz. coals, limestones, sandstones, mudstones) in real-world conditions.
The ADR scanner works by sending a narrow beam of energy into the ground using microwaves and radio waves. As it travels downward, the energy character of the beam is altered by the various rock layers it encounters. The beam is continually reflected back by these same rock layers and is recorded at the surface.
The recorded data quantify how rocks and minerals, including hydrocarbons, interact with the beam as it passes through them and pinpoints their composition. The technology measures the dielectric permittivity of the subsurface as well as characterizing the nature of the rock types based on analysis of both the spectroscopic and resona nt energy responses.
A key driver in pursuing development of ADR technology is to reduce the number of drill holes required to delineate a subsurface mineral or hydrocarbon reserve. To do this, laboratory analyses of rock specimens and data from training holes are used to guide the interpretation and analyses of the ADR results. As more samples are entered into Adrok’s proprietary library, the confidence in the results will increase.
Another benefit to this approach is that ADR requires no land-use permitting as use of the technology offers a non-destructive, environmentally friendly way of remotely deducing subsurface geology.
To date, ADR field deployment has been undertaken at many sites in the UK and overseas. ADR databases have been established for the principal igneous, metamorphic, and sedimentary rock types of Scotland. These databases, which have been confirmed by comparison with newly scanned sections and driven boreholes, offer considerable potential for future geological exploration. The technique has been used in prospecting for oil, gas, coal, and mineral deposits, but it is always important to remember that it is necessary to determine the ADR characteristics of the local rock sequences against known borehole data.
Since 2007, this ADR methodology has been successfully deployed as a geophysical service by Adrok in the exploration and appraisal of subsurface geological structures and targets (platinum group metals, zinc, nickel, copper, massive sulphides, uranium, and hydrocarbon deposits).
Further research and testing of the ADR system is being conducted to test the depth limits to which the ADR can penetrate as well as its reliability and repeatability of material classification (spectroscopic capabilities).
- Brown, M. A. E., M. T. Dean, I. H. S. Hall, A. D. McAdam, S. K. Monro, and S. I. Chisholm. 1996. A Lithostratigraphical Framework for the Carboniferous Rocks in the Midland Valley of Scotland British Geological Survey Technical Report, WA/96/29. Nottingham: British Geological Survey
- Cimino, J. B., and Elachi, C., eds. 1982. Shuttle Imaging Radar-A (SIR-A) Experiment , JPL Publication 82-77, 230 pp. Washington, DC: NASA Jet Propulsion Laboratory.
- Elachi, C., L. E. Roth, and G. G. Schaber. 1984. “IEEE Transactions on Geoscience and Remote Sensing.” GE-22 4: 383–8.
- Feynman, R. P. 1985. QED: The Strange Theory of Light and Matter . New York, NJ: Princeton University Press.
- Fisher, R. A., and F. Yates. 1963. Statistical Tables for Biological, Agricultural and Medical Research. 6th ed. Edinburgh: Oliver and Boyd.
- Forsyth, I. H., and J. I. Chisholm. 1977. The Geology of East Fife. Edinburgh: HMSO, 284 p.
- Geikie, A. 1900. The Geology of Central and Western Fife and Kinross, Memoir of the Geological Survey of Scotland , 284 p. Norwich: HMSO.
- McCauley, J. F., G. G. Schaber, C. S. Breed, M. J. Grolier, C. V. Haynes, B. Issawi, C. Elachi, and R. Blom. 1982. “Subsurface Valleys and Geoarchaeology of Eastern Sahara Revealed by Shuttle Radar.” Science 218: 1004–19.
- Read, W. A., M. A. E. Browne, D. Stephenson, and B. G. Upton. 2002. “Carboniferous” In The Geology of Scotland, edited by N. H. Trewin, 251–99. London: The Geological Society of London.
- Stove, G. C. 1983. “The Current Use of Remote-Sensing Data in Peat, Soil, Land-Cover and Crop Inventories in Scotland.” Philosophical Transactions of the Royal Society London A 309: 271–81.
- Stove, G. C. 1981. “The European SAR580 Experiment 1981 Report on Ground Data Collection Programme for Block GB1, Macaulay Institute for Soil Research Experiment 21GB.” In The European SAR-580 Experiment 1981–In-Situ Data Collection Reports “Ground/Sea Truth” , edited by B. M. Sorensen and E. Gatelli. Ispra: Joint Research Centre.
- Stove, G. C. 2005. Radar Apparatus for Imaging and/or Spectrometric Analysis and Methods of Performing Imaging and/or Spectrometric Analysis of a Substance for Dimensional Measurement, Identification and Precision Radar Mapping, USA Patent No.: 6864826, Edinburgh, GB: US Patent Office.
