
Adrok’s proprietary Atomic Dielectric Resonance technology is based on the principle that different materials will reflect and absorb electromagnetic radiation (radio waves, microwaves) at specific frequencies and energy levels. The ADR geophysical system transmits a pulse of electromagnetic energy containing a multispectral, patented (Stove, 2005) wave packet that resonates and reacts with the sub-surface materials. The reflections from the subsurface are recorded as a time domain trace and provide information about the location and composition of the materials encountered.
The ADR signal generator produces a pulse of electromagnetic energy (frequencies typically range between 1MHz to 70MHz) that is fed to the antenna and is transmitted into the ground. Once the signal has been sent to the transmitting antenna a signal is sent to the receiving control unit to synchronise collection of the subsurface reflected data, which is collected through the receiving antenna and then digitized. The transmitted pulse is depicted in Figure 1 where we also show the power spectrum (Stove & Doel, 2015). It is not the usual localized pulse with a single centre frequency but a more complicated waveform. The higher frequency components allow accurate localization at shallow depths, but attenuate rapidly in the ground, while the lowest frequency component around 3Mhz can penetrate much deeper. We thus combine the advantage of high spatial resolution at high frequencies with the advantage of greater depth penetration at low frequencies at the expense of requiring more sophisticated analysis (Doel et al., 2014).
When rocks of different compositions and textures have been exposed to ADR wave packets, a range of energy and frequency responses are detectable by suitable receivers. The recorded data describe how rocks and minerals, including hydrocarbons, interact with the electromagnetic radiation as it passes through them and pinpoints their composition. The technology measures the dielectric permittivity of the subsurface as well as characterizing the nature of the rock types based on analysis of both the spectroscopic and resonant energy responses.
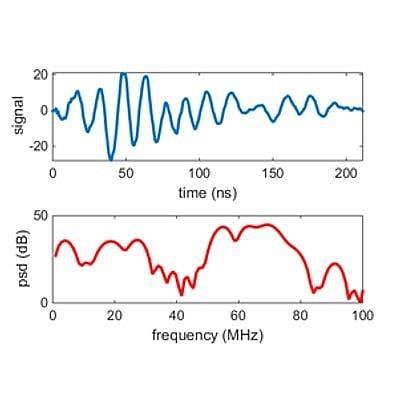
Figure 1: Example of an ADR wave packet in the time domain and its power spectral density.
ADR is a time domain electromagnetic (TDEM) method but differs significantly from methods such as inductive polarization (IP) and resistivity methods. Those methods employ much lower frequencies and do not involve propagating waves but rely on measuring currents and polarizations induced by (relatively) slowly varying electric or magnetic fields. ADR on the other hand uses propagating wave packets and derives subsurface properties from the changes in spectral content and energy measured in the reflections. As such the data analysis resembles seismic methods more than the usual TDEM inversion techniques. However, ADR waves are electromagnetic which are governed by different physics than seismic pressure waves.
Adrok has developed ray tracing and finite-difference time-domain (FDTD) simulation software for numerical simulation of the ADR wave propagation through various subsurface materials (Doel & Stove, 2016). Simulated scans are used for preliminary feasibility studies and for experimental design of specific field scans using ground models based on known geology and/or borehole data if available.
Wave propogation Model
Adrok have implemented a 1 + 1 dimensional time-domain finite difference simulation of Maxwell’s equations in a medium described by dielectric εr(x), static conductivity σ(x) and a Debye polarization model (Debye, 1929) with relaxation time τ to ac- count for frequency dependent losses (Doel & Stove, 2018). The model is similar to the one described in (Ciarletti et al., 2003), except we added a polarization component. Material properties are assumed to be constant in time but can depend on location. The model is summarized by the following system of partial differential equations:
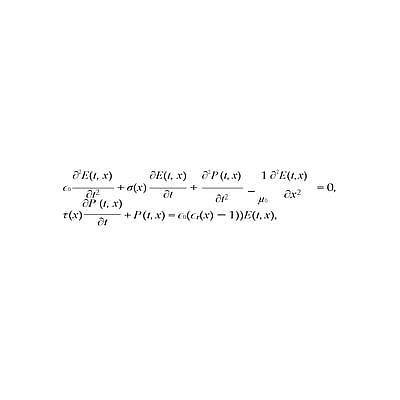
with E the electrical field, P the polarization, ε0 = 8.85 10−12F/m and μ0 = 4π 10−7H/m. The equations are discretized with a fourth order finite difference approximation for the spatial derivatives and a leap-frog method for the time step- ping (Ascher, 2008). At the simulation boundaries we use perfectly matched layers (Berenger, 1994). A spatial grid spacing of 10cm and a time step of 0.15ns was used and found to be accurate enough for frequencies up to 100MHz. The size of the absorbing boundaries were 400m on the top and 200m on the bottom.
This model permits the simulation of Stare scans, where transmitter and receiver are at (almost) the same position on the surface. During WARR scans we measure returns with transmitter and receiver at increasing separations. For this a two-dimensional simulation is required. Due to the small grid spacing necessary and the long simulation times to capture deep reflections a FDTD simulator would require very large computational resources. For this reason we used a ray tracing method instead. A ray emitted from the transmitter is intersected with a boundary from a layered earth model, and the ray is split into a transmitted and reflected ray using standard geometric optics methods. These two rays then hit other boundaries and are split again, leading to an exponential growth of the number of rays which we cull by tracking the amplitude attenuation due to reflection coefficients and propagation losses and dropping rays that are attenuated more than 60dB. After all rays are computed the received returns on a line on the surface are rendered by propagating the output of the transmitter through all rays, and applying frequency dependent attenuation as obtained from the FDTD model. We also add a direct ground wave component.
The emitted pulse of the modeled system was measured in air as a time domain trace. It is about 200ns long and contains frequency components from 2 70MHz with significant peaks at 3, 20, 30, and 65MHz (Doel et al., 2014). Noise levels (background and internal) were measured to be about 1% of the peak value of the amplitude at a distance of 1m and are added to the simulated measurements accordingly. In normal operation mode the receiver collects 500 traces which are stacked for noise reduction. Maximum acquisition rate for 20μs long traces is 10, 000 traces per minute. The sampling rate is 2.5GHz.
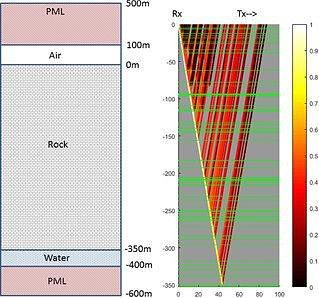
Figure 2. On left: Example of a simulation domain consisting of air, rock, and a reflecting water layer. The domain is padded on both sides with perfectly matched layers to eliminate unphysical reflections from the domain boundaries. On right: A single ray propagating in the domain. Horizontal green lines divide regions with slightly different dielectric. The ray, computed from receiver (Rx) to transmitter (Tx) using time-invariance, splits at each intersection. Amplitude decreases in accordance with the reflection coefficients and propagation losses and is indicated in colour, with 1 the initial relative amplitude. Data is collected at the surface on a grid of locations. A total of 5000 rays are computed at various angles and added.
Results indicate that with the modelled equipment a water layer can be detected quickly at a depth of 350m through resistive host rock such as permafrost by detecting the arrival time of the reflection using a correlation analysis of a Stare scan and a phase-based velocity spectrum analysis of a WARR scan over a 100m line (Figure 2). Small irregularities in dielectric of about 0.25 in the are beneficial for the interpretation but if these fluctuation become very large multiples interfere with dielectric estimation. Under the constraint of a one-day experiment (including a WARR scan) and limitations on the scan rate, maximum exploration depth was estimated at 600m. Results from this specific scenario may be applicable to exploration in other highly resistive Earth-based materials such as granite, igneous rocks, and certain types of coal (Reynolds, 1998).
This is further explained in the peer-reviewed technical publication by Doel & Stove, 2018.
For skin depth discussions, please read Stove G., October 2018, Extending the Reach of Radio Waves for Subsurface Water Detection, Canadian Society of Exploration Geophysicists (CSEG), https://csegrecorder.com/articles/view/extending-the-reach-of-radio-waves-for-subsurface-water- detection
The depth of penetration of the transmitted PEM wave packets can be tuned to different transmission frequencies and energies (and two-way travel times) to suit different distance scales of propagation through solid objects. Maxwell's equations govern electromagnetic phenomena in vacuum only. To model propagation in materials such as the earth a specific model of the electrical properties of the earth has to be created and then coupled to the Maxwell equations (Doel et al. 2014, Doel & Stove, 2016). Such models are phenomenological and usually have several parameters that are difficult to measure in-situ. For deep penetration applications for subsurface natural resource mapping at the geological scale, a wavelength of 30m tends to be used. When a single photon is transmitted at these wavelengths, then the depth error in subsurface feature localisation will be around 30m. If N photons are used the theoretical error is 30m/sqrt(N). Classically Adrok have used phase information to accurately locate a reflector. In practice, depth accuracy is limited by sampling rate, and not the theoretical limit as N is of course very large.
The measured signal strength versus distance (as demonstrated in the paper by Doel et al., 2014) is shown in figure 4 below:
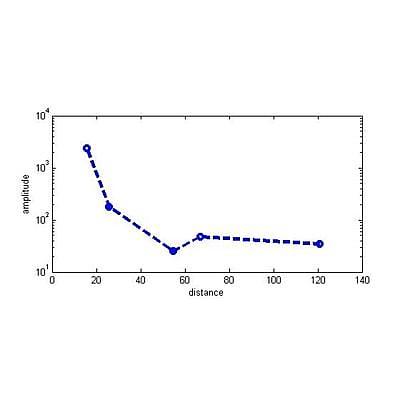
Figure 4. Empirically determined strength of ADR signal penetration, showing signal strength lessens with depth but does not reach zero
Depth is measured from time and velocity by ray tracing and Normal Move Out (NMO) computations, similar to the methods used in the seismic industry (Stove, G. D. C., Stove, G.C., and Robinson, M., 2018).
References
Ascher, U., 2008, Numerical methods for evolutionary differential equations: SIAM.
Berenger, J., 1994, A perfectly matched layer for the absorption of electromagnetic waves: Journal of Computational Physics, 114, 185–200.
Ciarletti, V., B. Martinat, A. Reineix, J. J. Berthelier, and R. Ney, 2003, Numerical simulation of the operation of the gpr experiment on netlander: JOURNAL OF GEOPHYSICAL RESEARCH, 108, doi:10.1029/2002JE00186.
Debye, P., 1929, Polar molecules: Chemical Catalogue Company.
Doel, van den, K., Jansen, J., Robinson, M., Stove, G.C., Stove, G. D. C., 2014, Ground penetrating abilities of broadband pulsed radar in the 1-70MHz range, proc. SEG, Denver.
Doel, van den, K., Stove, G., 2016, Modeling and Simulation of a Deeply Penetrating Low Frequency Subsurface Radar System, proc. EAGE, Vienna.
Doel, van den, K., Stove, G.D.C., 2018, Modelling and Simulation of Low Frequency Subsurface Radar Imaging in Permafrost: Computer Science and Information Technology, 6(3), 40–45.
Reynolds, J. M., 1998, An introduction to Applied and Environ- mental Geophysics: John Wiley and Sons.
Stove, G. C., 2005, Radar Apparatus for Imaging and/or Spectrometric Analysis and Methods of Performing Imaging and/or Spectrometric Analysis of a Substance for Dimensional Measurement, Identification and Precision Radar Mapping, USA Patent No.: 6864826, Edinburgh, GB: US Patent Office.
Stove, G. D. C., and K. van den Doel, 2015. Large depth exploration using pulsed radar. In: ASEG-PESA Technical Program Expanded Abstracts 2015, Perth. 1–4.
Stove G., October 2018, Extending the Reach of Radio Waves for Subsurface Water Detection, Canadian Society of Exploration Geophysicists (CSEG), https://csegrecorder.com/articles/view/extending-the-reach-of-radio-waves-for-subsurface-water- detection
Stove, G. D. C., Stove, G.C., and Robinson, M., 2018, New method for monitoring steam injection for Enhanced Oil Recovery (EOR) and for finding sources of geothermal heat. Australasian Exploration Geoscience Conference 2018 (AEGC), Sydney.
